. 2011 Oct;339(1):9-23.
doi: 10.1124/jpet.111.182873. Epub 2011 Jun 28.

Genetic variants in cytosolic 5'-nucleotidase II are associated with its expression and cytarabine sensitivity in HapMap cell lines and in patients with acute myeloid leukemia

Affiliations

Genetic variants in cytosolic 5'-nucleotidase II are associated with its expression and cytarabine sensitivity in HapMap cell lines and in patients with acute myeloid leukemia

Amit K Mitra et al. J Pharmacol Exp Ther. 2011 Oct.

Abstract

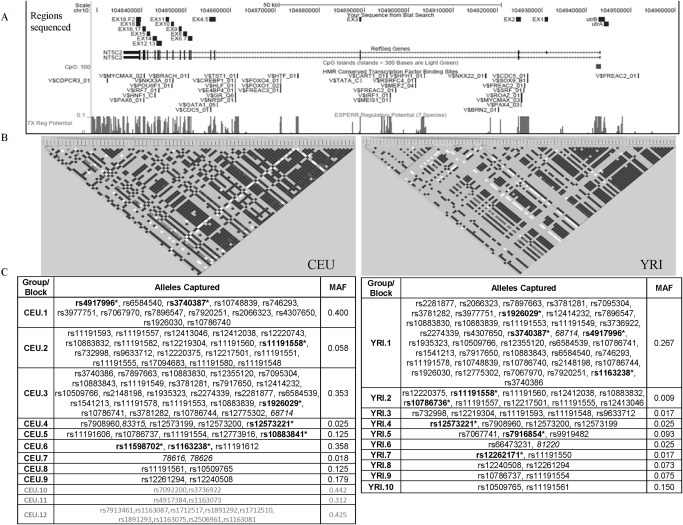
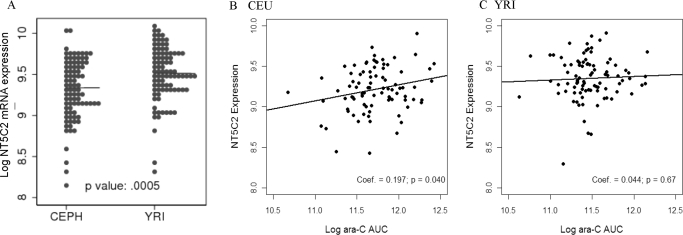
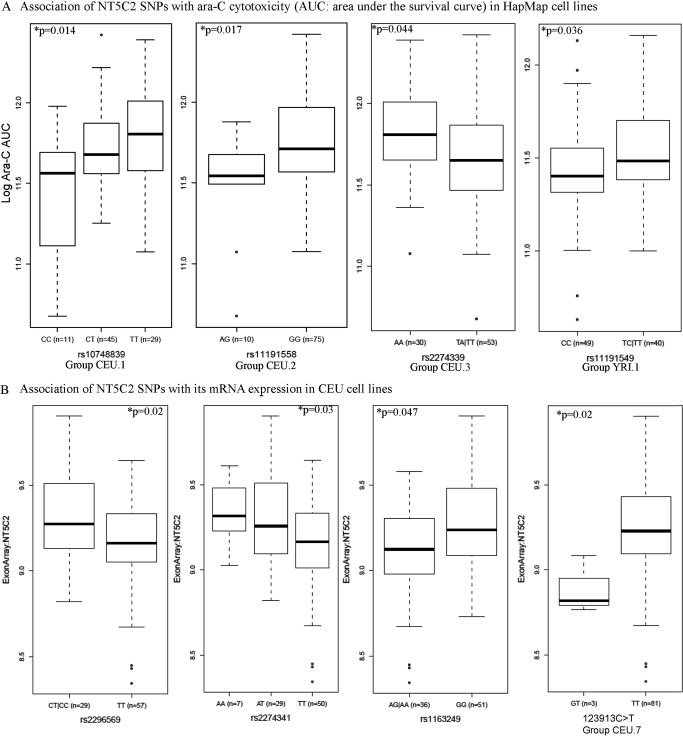
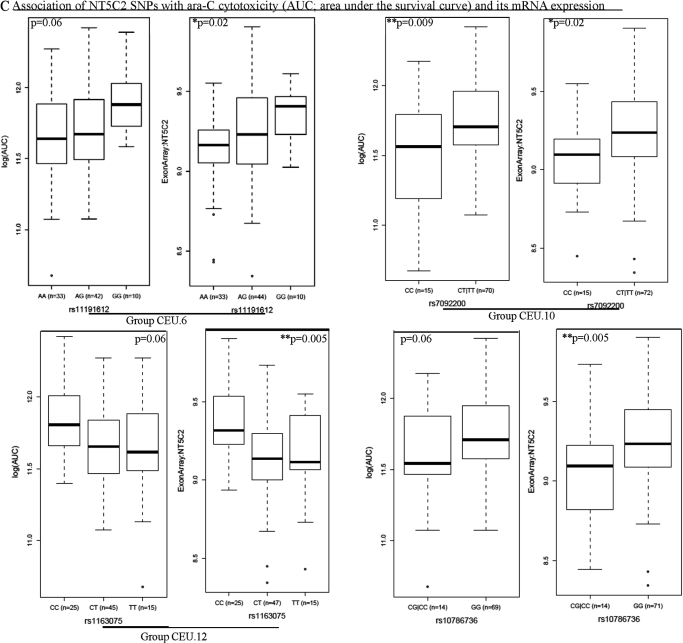
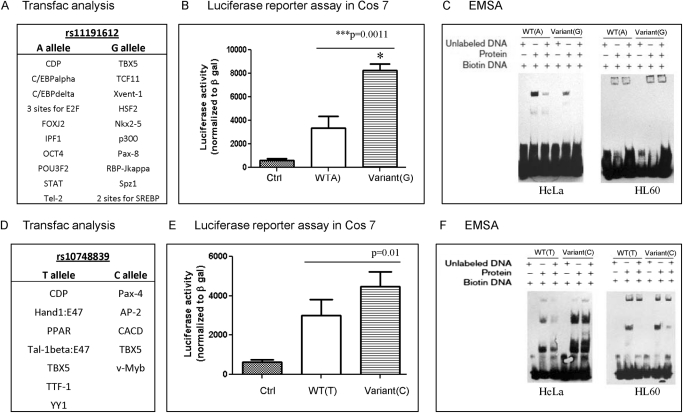
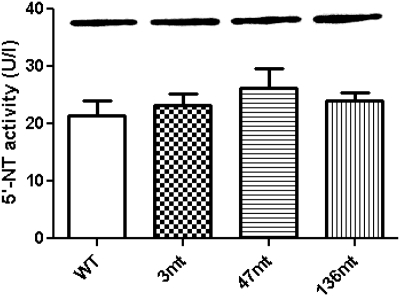
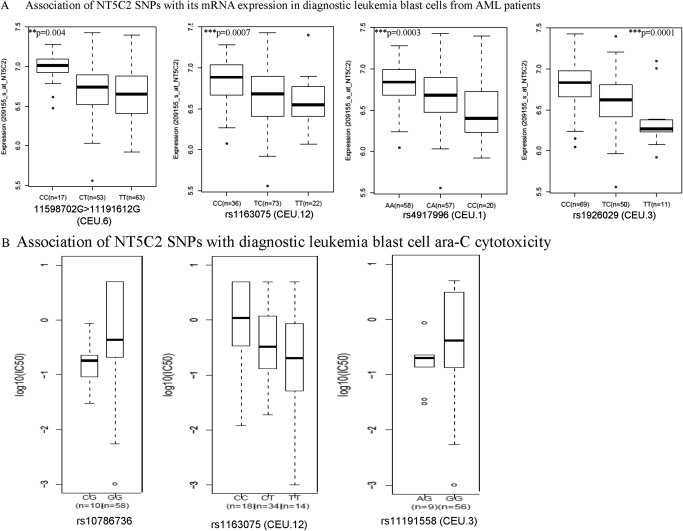
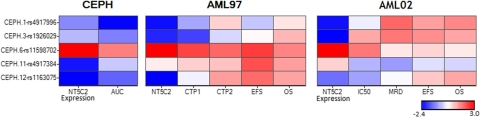
Cytosolic 5'-nucleotidase II (NT5C2) is involved in the development of 1-β-d-arabinofuranosylcytosine (ara-C) resistance and has been associated with clinical outcome in patients receiving ara-C-based chemotherapy. NT5C2 inactivates ara-C by dephosphorylating ara-C monophosphate to ara-C. In this study, we sequenced NT5C2 in genomic DNA samples from International HapMap project panels with European [Centre d'Etude du Polymorphisme Humain (CEU); n = 90] or African [Yoruba people in Ibadan, Nigeria (YRI); n = 90] ancestry. We identified 41 genetic variants [one insertion-deletion and 40 single nucleotide polymorphisms (SNPs)], including three nonsynonymous SNPs (Y3A, K47R, and Q136R). Twenty-five SNPs were novel and 16 overlapped with the HapMap data. Subjects with African ancestry had NT5C2 mRNA expression levels that was significantly higher than those with European ancestry (p = 0.005). Furthermore, there was a correlation between NT5C2 mRNA expression and ara-C sensitivity in CEU but not in YRI cell lines. None of the nonsynonymous SNPs demonstrated any effect on NT5C2 activity. The genotypes of several SNPs were significantly associated with NT5C2 mRNA expression and/or ara-C sensitivity in CEU cell lines, but very few were significant in YRI cell lines. Of most interest, SNPs (linkage disequilibrium group CEU.12) in the 5'-untranslated region were associated with NT5C2 expression and ara-C sensitivity in HapMap cell lines and with NT5C2 mRNA expression and ara-C sensitivity in diagnostic leukemic blasts from pediatric patients with acute myeloid leukemia. Functional genomics analysis demonstrated that the promoter SNP rs11191612 was associated with altered luciferase activation in reporter assays and altered DNA-protein binding in gel shift assays. These results suggest that genetic variations in NT5C2 influence its expression and, potentially, cellular responses to nucleoside analogs.


Figures

Fig. 1.
Fig. 1.
A, snapshot from the UCSC genome browser for NT5C2 locus. The regions sequenced in HapMap panels are shown by small boxes in the first panel followed by (B) LD plot of NT5C2 in samples with European (CEU) and African (YRI) ancestry. LD plots were generated in Haploview using genotype data from the present study and from HapMap for both CEU and YRI samples. The color scheme is as follows: white when r2 = 0, shades of light gray when 0 < r2 < 1, and black when r2 = 1. C, LD groups within CEU and YRI. SNPs that are linked, r2 > 0.8 (and picked by the tagger program), are categorized in the same groups. SNPs without rs numbers are indicated by number corresponding to Table 1. SNPs genotyped in patients with AML are bold with an asterisk. LD groups CEU 10 to 12 (gray) represent SNPs present upstream of NT5C2 gene. MAF, minimum allele frequency for the group.
Fig. 2.
Fig. 2.
A, NT5C2 mRNA expression (extracted from GSE7761) in Epstein-Barr virus-transformed lymphoblast cell lines derived from subjects with European (CEU) and African (YRI) ancestry. Median values for log2NT5C2 mRNA levels are indicated by a horizontal line for each ethnic group. B and C, correlation of NT5C2 expression with ara-C cytotoxicity in CEU and YRI cell lines. Ara-C cytotoxicity was determined as described under Materials and Methods. *, p < 0.05; **, p < 0.01.
Fig. 3.
Fig. 3.
A, NT5C2 SNPs associated with ara-C cytotoxicity in HapMap cell lines. Box plots for the association of representative NT5C2 SNPs (rs10748839 for CEU.1, rs11191558 for CEU.2, rs2274339 for CEU.3, and rs11191549 for YRI.1) with ara-C AUC in CEU and YRI samples are shown. Plots show medians as a line between boxes, which represent first and the third quartiles; the whiskers represent the range after outliers were excluded. The outliers are defined as data points that fall outside of the first and third quartiles by more than 1.5 times the interquartile range. Circles falling outside the whiskers represent outliers. B, NT5C2 SNPs associated with NT5C2 mRNA expression levels in HapMap cell lines. Box plots for the association of NT5C2 SNPs rs2296569, rs2274341, rs1163249, and 123193 (representing the CEU.7 group) with its mRNA expression in CEU cell lines are shown. C, NT5C2 SNPs associated with its mRNA expression levels and ara-C cytotoxicity in HapMap cell lines. Box plots for the association of NT5C2 SNPs rs11191612 (representing CEU.6), rs7092200 (representing CEU.10), rs1163075 (representing CEU.12), and singleton SNP rs10786736 with its mRNA expression and ara-C AUC in CEU cell lines are shown.
Fig. 3.
Fig. 3.
A, NT5C2 SNPs associated with ara-C cytotoxicity in HapMap cell lines. Box plots for the association of representative NT5C2 SNPs (rs10748839 for CEU.1, rs11191558 for CEU.2, rs2274339 for CEU.3, and rs11191549 for YRI.1) with ara-C AUC in CEU and YRI samples are shown. Plots show medians as a line between boxes, which represent first and the third quartiles; the whiskers represent the range after outliers were excluded. The outliers are defined as data points that fall outside of the first and third quartiles by more than 1.5 times the interquartile range. Circles falling outside the whiskers represent outliers. B, NT5C2 SNPs associated with NT5C2 mRNA expression levels in HapMap cell lines. Box plots for the association of NT5C2 SNPs rs2296569, rs2274341, rs1163249, and 123193 (representing the CEU.7 group) with its mRNA expression in CEU cell lines are shown. C, NT5C2 SNPs associated with its mRNA expression levels and ara-C cytotoxicity in HapMap cell lines. Box plots for the association of NT5C2 SNPs rs11191612 (representing CEU.6), rs7092200 (representing CEU.10), rs1163075 (representing CEU.12), and singleton SNP rs10786736 with its mRNA expression and ara-C AUC in CEU cell lines are shown.
Fig. 4.
Fig. 4.
Functional characterization of NT5C2 promoter SNPs rs11191612 and rs10748839. A and D, differences in transcription factor binding sites for WT and variant alleles of rs11191612 and rs10748839 identified by Transfac analysis. B and E, luciferase reporter assays comparing transcriptional activation NT5C2-pGL3basic vectors with WT or variant alleles of rs11191612 and rs10748839. Transfection efficiency was normalized to β-galactosidase activity. C and F, representative EMSA gels comparing binding of oligos representing WT and variant alleles of promoter SNPs after incubation with HL60 and HeLa nuclear extracts.
Fig. 5.
Fig. 5.
Activity of recombinant human NT5C2 WT and mutant proteins. NT5C2 WT and amino acid variant (T3A, K47N, and Q136R) isoforms were expressed in BL21 E. coli. The columns represent activity of NT5C2 isoforms that was determined using a Diazyme 5′-Nucleotidase Enzymatic Test Kit. Activities of NT5C2 amino acid variants were compared with that of WT protein, and no difference in activity was observed. Inset shows a representative Western blot when equal amounts of total protein were loaded for WT and mutant NT5C2 proteins; all of the recombinant NT5C2 variants were expressed at equivalent levels.
Fig. 6.
Fig. 6.
A, NT5C2 promoter with CpG sites. Bisulfite-modified genomic DNA sequence of the CpG region of the human NT5C2 gene. The position of the primers that were used for methylation-specific PCR after bisulfite treatment are indicated by forward and reverse arrows for primer 1 to primer 5 covering five different regions of the CpG island. The bisulfite treatment converted the unmethylated cytosine to uracil, which is complementary to adenosine. B, methylation analysis of five CpG sites in the NT5C2 promoter. Representative agarose gels showing methylation patterns in sensitive and resistant HapMap (CEU) cell lines for the NT5C2 primer1 to primer 5. M, band for methylated primers; U, band for unmethylated primers. The positive control (ctrl) methylated and unmethylated bands was used from EpiTect PCR Control DNA Set.
Fig. 7.
Fig. 7.
A, association of NT5C2 SNPs with mRNA expression in diagnostic AML leukemic blasts. NT5C2 mRNA expression levels in diagnostic leukemic blasts were extracted from Affymetrix U133A array data from 137 patients (AML97, n = 41; AML02, n = 96) and were analyzed for association with NT5C2 SNPs. Box plots for association of NT5C2 SNPs rs11598702 (representing CEU.6), rs1163075 (representing CEU.12), rs4917996 (representing CEU.1), and rs1926029 (CEU.3) with its mRNA expression in diagnostic leukemic blasts from AML patients are shown. B, association of NT5C2 SNPs with diagnostic blast ara-C cytotoxicity. Ara-C cytotoxicity was determined by treating diagnostic leukemic blasts with varying concentrations of ara-C, and LC50 values were calculated. Box plots represent association of NT5C2 SNPs (rs1078636 and rs1163075 representing CEU.12 and rs11191558 representing CEU.3) in all patients.
Fig. 8.
Fig. 8.
Heat map of association of the five most interesting NT5C2 SNPs with multiple endpoints in HapMap and AML samples. Each row represents a SNP representing different LD groups, and each column represents a phenotype. Blue represents association of a minor allele with reduced levels of phenotype and red represents association of a minor allele with an increased value for the phenotype. The colors are assigned by log10 p value according to the accompanying color scale.

References

    1. Amici A, Emanuelli M, Magni G, Raffaelli N, Ruggieri S. (1997) Pyrimidine nucleotidases from human erythrocyte possess phosphotransferase activities specific for pyrimidine nucleotides. FEBS Lett 419:263–267 - PubMed
    1. Amici A, Magni G. (2002) Human erythrocyte pyrimidine 5′-nucleotidase, PN-I. Arch Biochem Biophys 397:184–190 - PubMed
    1. Children's Oncology Group, Aplenc R, Alonzo TA, Gerbing RB, Smith FO, Meshinchi S, Ross JA, Perentesis J, Woods WG, Lange BJ, et al. (2006) Ethnicity and survival in childhood acute myeloid leukemia: a report from the Children's Oncology Group. Blood 108:74–80 - PMC - PubMed
    1. Beesley AH, Palmer ML, Ford J, Weller RE, Cummings AJ, Freitas JR, Firth MJ, Perera KU, de Klerk NH, Kees UR. (2006) Authenticity and drug resistance in a panel of acute lymphoblastic leukaemia cell lines. Br J Cancer 95:1537–1544 - PMC - PubMed
    1. Bianchi V, Pontis E, Reichard P. (1986) Interrelations between substrate cycles and de novo synthesis of pyrimidine deoxyribonucleoside triphosphates in 3T6 cells. Proc Natl Acad Sci USA 83:986–990 - PMC - PubMed

Publication types

MeSH terms