

Methylator phenotype of malignant germ cell tumours in children identifies strong candidates for chemotherapy resistance
- PMID: 21712824
- PMCID: PMC3170957
- DOI: 10.1038/bjc.2011.218
Methylator phenotype of malignant germ cell tumours in children identifies strong candidates for chemotherapy resistance
Abstract
Background: Yolk sac tumours (YSTs) and germinomas are the two major pure histological subtypes of germ cell tumours. To date, the role of DNA methylation in the aetiology of this class of tumour has only been analysed in adult testicular forms and with respect to only a few genes.
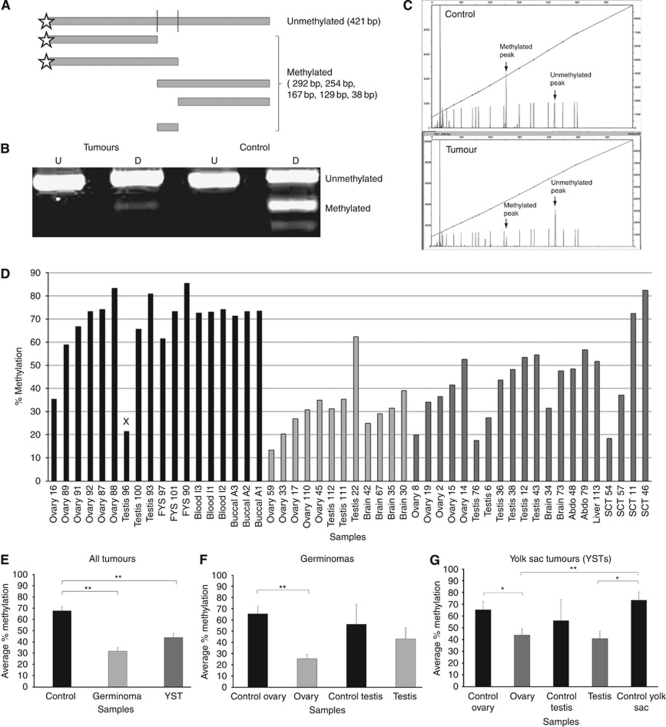
Methods: A bank of paediatric tumours was analysed for global methylation of LINE-1 repeat elements and global methylation of regulatory elements using GoldenGate methylation arrays.
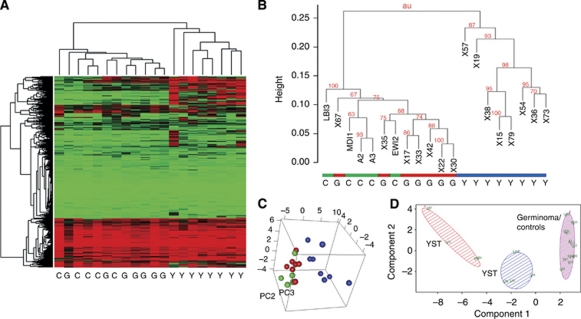
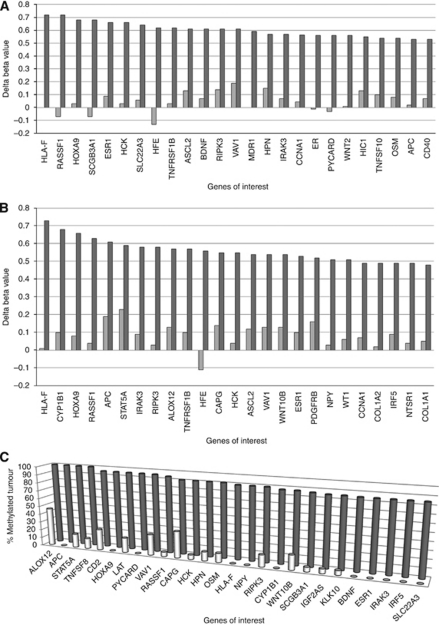
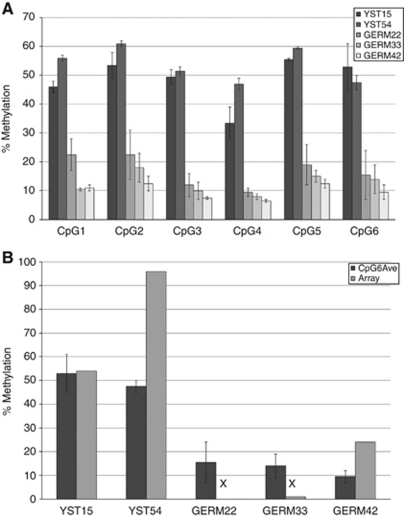
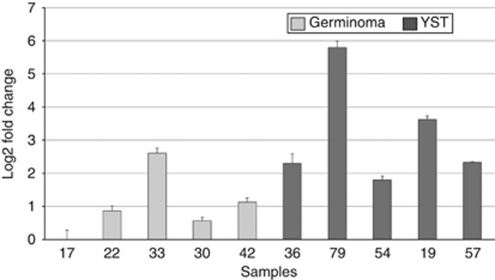
Results: Both germinomas and YSTs exhibited significant global hypomethylation of LINE-1 elements. However, in germinomas, methylation of gene regulatory regions differed little from control samples, whereas YSTs exhibited increased methylation at a large proportion of the loci tested, showing a 'methylator' phenotype, including silencing of genes associated with Caspase-8-dependent apoptosis. Furthermore, we found that the methylator phenotype of YSTs was coincident with higher levels of expression of the DNA methyltransferase, DNA (cytosine-5)-methyltransferase 3B, suggesting a mechanism underlying the phenotype.
Conclusion: Epigenetic silencing of a large number of potential tumour suppressor genes in YSTs might explain why they exhibit a more aggressive natural history than germinomas and silencing of genes associated with Caspase-8-dependent cell death might explain the relative resistance of YSTs to conventional therapy.
Conflict of interest statement
The authors declare no conflict of interest.
Figures
Similar articles
-
The two most common histological subtypes of malignant germ cell tumour are distinguished by global microRNA profiles, associated with differential transcription factor expression.Mol Cancer. 2010 Nov 8;9:290. doi: 10.1186/1476-4598-9-290. Mol Cancer. 2010. PMID: 21059207 Free PMC article.
-
Differences in DNA methylation profiles by histologic subtype of paediatric germ cell tumours: a report from the Children's Oncology Group.Br J Cancer. 2018 Oct;119(7):864-872. doi: 10.1038/s41416-018-0277-5. Epub 2018 Oct 5. Br J Cancer. 2018. PMID: 30287918 Free PMC article.
-
Comprehensive genetic analysis of pediatric germ cell tumors identifies potential drug targets.Commun Biol. 2020 Sep 30;3(1):544. doi: 10.1038/s42003-020-01267-8. Commun Biol. 2020. PMID: 32999426 Free PMC article.
-
Germ cell tumors of the gonads: a selective review emphasizing problems in differential diagnosis, newly appreciated, and controversial issues.Mod Pathol. 2005 Feb;18 Suppl 2:S61-79. doi: 10.1038/modpathol.3800310. Mod Pathol. 2005. PMID: 15761467 Review.
-
Interphase cytogenetics on paraffin sections of paediatric extragonadal yolk sac tumours.Virchows Arch. 1996 Apr;428(1):53-7. doi: 10.1007/BF00192927. Virchows Arch. 1996. PMID: 8646370 Review.
Cited by
-
The epigenetic regulatory mechanism of PIWI/piRNAs in human cancers.Mol Cancer. 2023 Mar 7;22(1):45. doi: 10.1186/s12943-023-01749-3. Mol Cancer. 2023. PMID: 36882835 Free PMC article. Review.
-
Variants in BAK1, SPRY4, and GAB2 are associated with pediatric germ cell tumors: A report from the children's oncology group.Genes Chromosomes Cancer. 2017 Jul;56(7):548-558. doi: 10.1002/gcc.22457. Epub 2017 Apr 4. Genes Chromosomes Cancer. 2017. PMID: 28295819 Free PMC article.
-
CNS Germ Cell Tumors: Molecular Advances, Significance in Risk Stratification and Future Directions.Brain Sci. 2024 Apr 29;14(5):445. doi: 10.3390/brainsci14050445. Brain Sci. 2024. PMID: 38790424 Free PMC article. Review.
-
CNS germinomas are characterized by global demethylation, chromosomal instability and mutational activation of the Kit-, Ras/Raf/Erk- and Akt-pathways.Oncotarget. 2016 Aug 23;7(34):55026-55042. doi: 10.18632/oncotarget.10392. Oncotarget. 2016. PMID: 27391150 Free PMC article.
-
Replenishing co-downregulated miR-100-5p and miR-125b-5p in malignant germ cell tumors causes growth inhibition through cell cycle disruption.Mol Oncol. 2025 Apr;19(4):1203-1228. doi: 10.1002/1878-0261.13757. Epub 2024 Nov 10. Mol Oncol. 2025. PMID: 39522951 Free PMC article.
References
-
- Andreeva AV, Kutuzov MA (2010) Cadherin 13 in cancer. Genes Chromosomes Cancer 49: 775–790 - PubMed
-
- Beaulieu N, Morin S, Chute IC, Robert MF, Nguyen H, MacLeod AR (2002) An essential role for DNA methyltransferase DNMT3B in cancer cell survival. J Biol Chem 277: 28176–28181 - PubMed
-
- Benjamini Y, Hochberg Y (1995) Controlling the false discovery rate – a practical and powerful approach to multiple testing. J R Statist Soc Ser B 57: 289–300
Publication types
MeSH terms
Substances
Grants and funding
LinkOut - more resources
Full Text Sources
