

Measuring and modelling occupancy time in NHS continuing healthcare
- PMID: 21714903
- PMCID: PMC3152883
- DOI: 10.1186/1472-6963-11-155
Measuring and modelling occupancy time in NHS continuing healthcare
Abstract
Background: Due to increasing demand and financial constraints, NHS continuing healthcare systems seek to find better ways of forecasting demand and budgeting for care. This paper investigates two areas of concern, namely, how long existing patients stay in service and the number of patients that are likely to be still in care after a period of time.
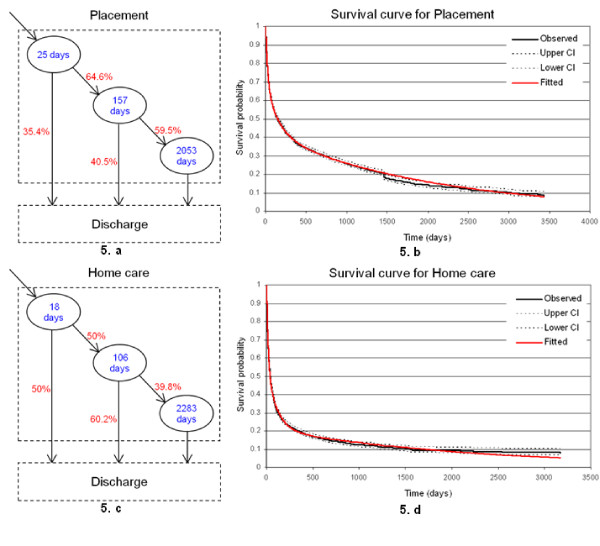
Methods: An anonymised dataset containing information for all funded admissions to placement and home care in the NHS continuing healthcare system was provided by 26 (out of 31) London primary care trusts. The data related to 11289 patients staying in placement and home care between 1 April 2005 and 31 May 2008 were first analysed. Using a methodology based on length of stay (LoS) modelling, we captured the distribution of LoS of patients to estimate the probability of a patient staying in care over a period of time. Using the estimated probabilities we forecasted the number of patients that are likely to be still in care after a period of time (e.g. monthly).
Results: We noticed that within the NHS continuing healthcare system there are three main categories of patients. Some patients are discharged after a short stay (few days), some others staying for few months and the third category of patients staying for a long period of time (years). Some variations in proportions of discharge and transition between types of care as well as between care groups (e.g. palliative, functional mental health) were observed. A close agreement of the observed and the expected numbers of patients suggests a good prediction model.
Conclusions: The model was tested for care groups within the NHS continuing healthcare system in London to support Primary Care Trusts in budget planning and improve their responsiveness to meet the increasing demand under limited availability of resources. Its applicability can be extended to other types of care, such as hospital care and re-ablement. Further work will be geared towards updating the dataset and refining the results.
Figures


Similar articles
-
Emergency transfer from independent hospitals to NHS hospitals: risk, reasons and cost.J Public Health Med. 2001 Dec;23(4):301-5. doi: 10.1093/pubmed/23.4.301. J Public Health Med. 2001. PMID: 11873892
-
Patients and procedures in short-stay independent hospitals in England and Wales, 1997-1998.J Public Health Med. 2000 Mar;22(1):68-73. doi: 10.1093/pubmed/22.1.68. J Public Health Med. 2000. PMID: 10774907
-
The impact of a new emergency admission avoidance system for older people on length of stay and same-day discharges.Age Ageing. 2014 Jan;43(1):116-21. doi: 10.1093/ageing/aft086. Epub 2013 Aug 1. Age Ageing. 2014. PMID: 23907007
-
Clinical predictors of protracted length of stay in Ontario Complex Continuing Care hospitals.BMC Health Serv Res. 2019 Apr 5;19(1):218. doi: 10.1186/s12913-019-4024-2. BMC Health Serv Res. 2019. PMID: 30953489 Free PMC article.
-
Demand at the emergency department front door: 10-year trends in presentations.Med J Aust. 2012 Feb 6;196:128-32. doi: 10.5694/mja11.10955. Med J Aust. 2012. PMID: 22304608
Cited by
-
Research on Disability Grading Based on ICF Functional Framework: Empirical Evidence From Zhejiang Province, China.Front Public Health. 2021 May 11;9:616180. doi: 10.3389/fpubh.2021.616180. eCollection 2021. Front Public Health. 2021. PMID: 34046386 Free PMC article.
-
Modeling the demand for long-term care services under uncertain information.Health Care Manag Sci. 2012 Dec;15(4):385-412. doi: 10.1007/s10729-012-9204-0. Epub 2012 Jul 11. Health Care Manag Sci. 2012. PMID: 22782558
-
The Health Status Transition and Medical Expenditure Evaluation of Elderly Population in China.Int J Environ Res Public Health. 2021 Jun 27;18(13):6907. doi: 10.3390/ijerph18136907. Int J Environ Res Public Health. 2021. PMID: 34199100 Free PMC article.
-
A structured review of long-term care demand modelling.Health Care Manag Sci. 2015 Jun;18(2):173-94. doi: 10.1007/s10729-014-9299-6. Epub 2014 Oct 28. Health Care Manag Sci. 2015. PMID: 25348171 Review.
References
-
- Department of Health. The national framework for NHS continuing healthcare and NHS funded nursing care. 2007. http://www.dh.gov.uk/en/Publicationsandstatistics/Publications/Publicati...
-
- Department of Health. Raising the Profile of Long Term Conditions Care: A Compendium of Information. 2008. http://www.dh.gov.uk/en/Publicationsandstatistics/Publications/Publicati...
-
- Struthers JL. The elderly in hospital. Br Med J. 1963;1:470.
-
- Millard PH. MD thesis. University of London; 1988. Geriatric medicine: a new method of measuring bed usage and a theory for planning.
-
- Harrison GW, Millard PH. Balancing acute and long-term care: the mathematics of throughput in departments of geriatric medicine. Methods Inf Med. 1991;30(3):221–228. - PubMed
Publication types
MeSH terms
LinkOut - more resources
Full Text Sources
Miscellaneous
