

Influence of cell cycle on responses of MCF-7 cells to benzo[a]pyrene
- PMID: 21714911
- PMCID: PMC3145607
- DOI: 10.1186/1471-2164-12-333
Influence of cell cycle on responses of MCF-7 cells to benzo[a]pyrene
Abstract
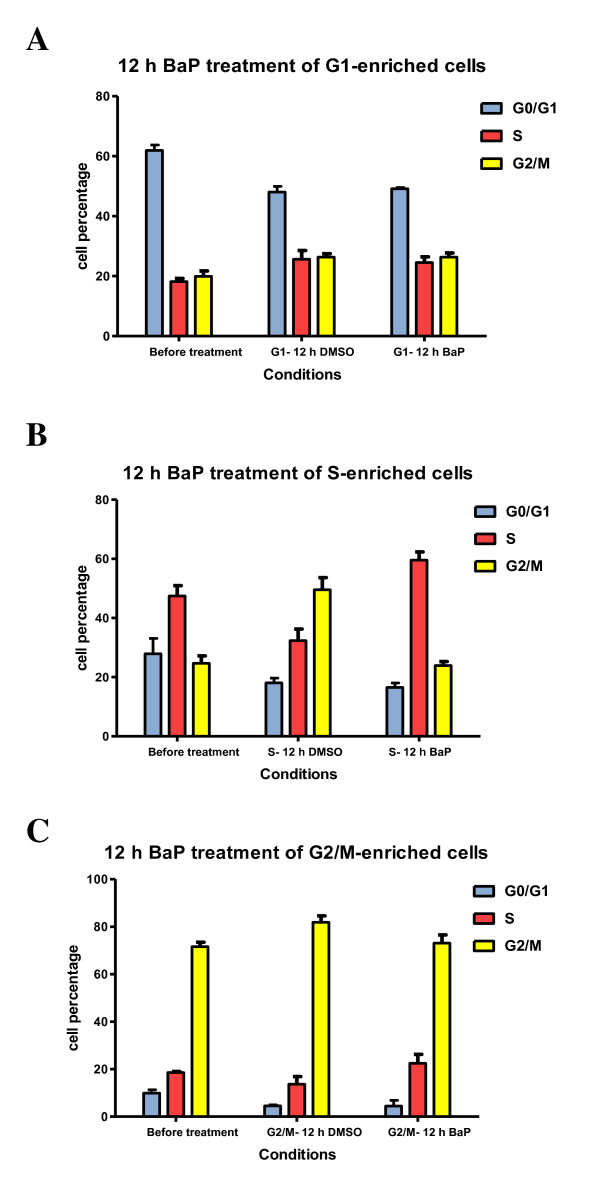
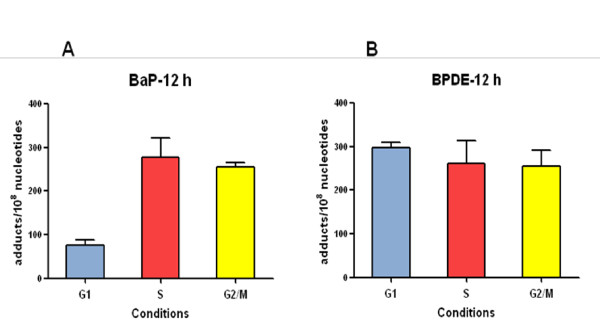
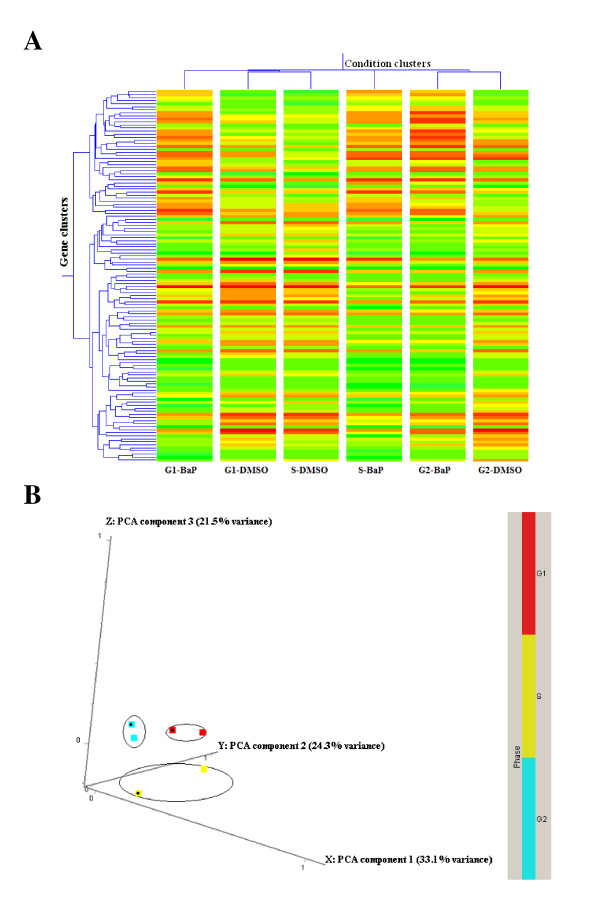
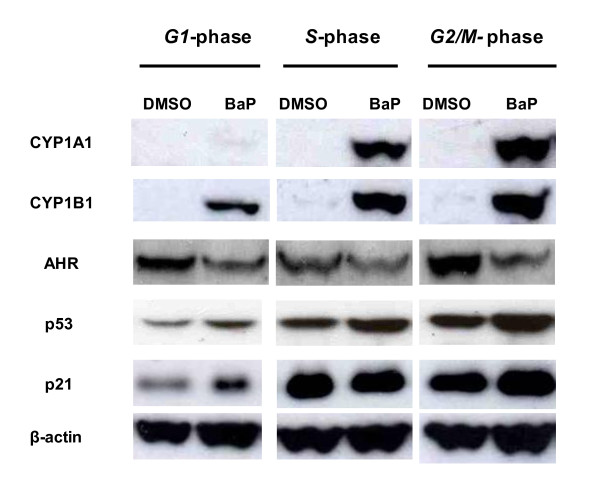
Background: Benzo[a]pyrene (BaP) is a widespread environmental genotoxic carcinogen that damages DNA by forming adducts. This damage along with activation of the aryl hydrocarbon receptor (AHR) induces complex transcriptional responses in cells. To investigate whether human cells are more susceptible to BaP in a particular phase of the cell cycle, synchronised breast carcinoma MCF-7 cells were exposed to BaP. Cell cycle progression was analysed by flow cytometry, DNA adduct formation was assessed by 32P-postlabeling analysis, microarrays of 44K human genome-wide oligos and RT-PCR were used to detect gene expression (mRNA) changes and Western blotting was performed to determine the expression of some proteins, including cytochrome P450 (CYP) 1A1 and CYP1B1, which are involved in BaP metabolism.
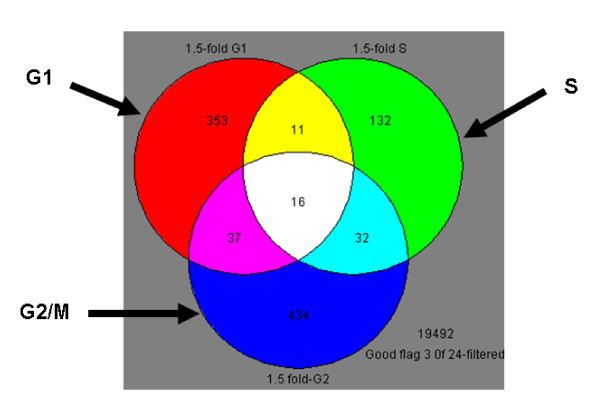
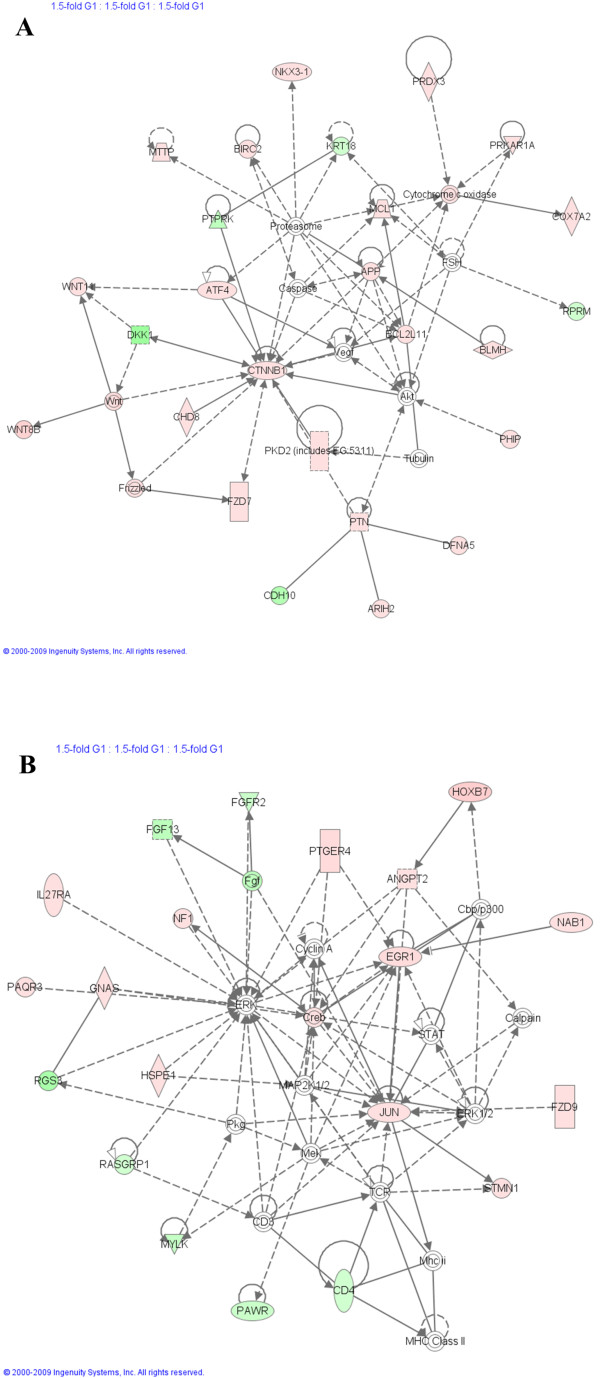
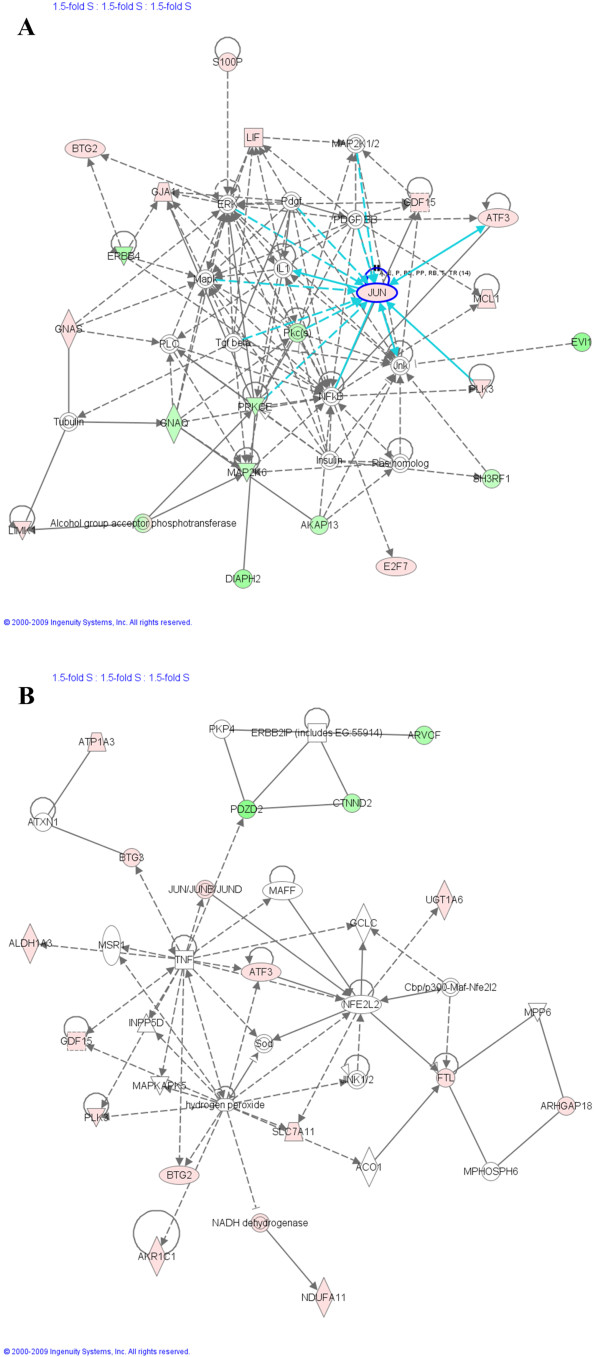
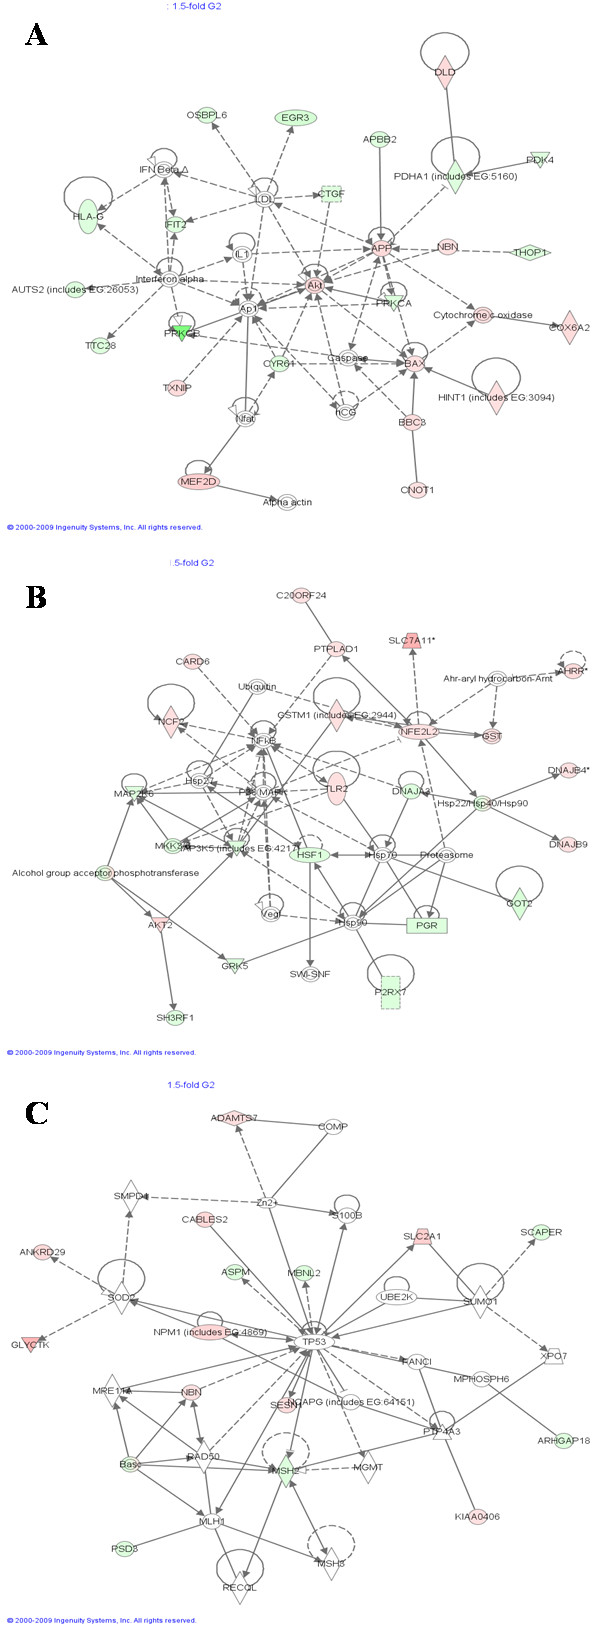
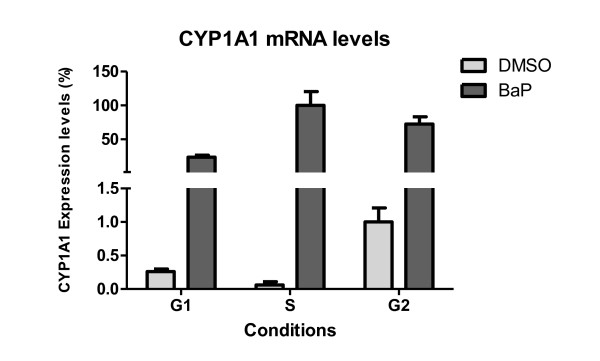
Results: Following BaP exposure, cells evaded G1 arrest and accumulated in S-phase. Higher levels of DNA damage occurred in S- and G2/M- compared with G0/G1-enriched cultures. Genes that were found to have altered expression included those involved in xenobiotic metabolism, apoptosis, cell cycle regulation and DNA repair. Gene ontology and pathway analysis showed the involvement of various signalling pathways in response to BaP exposure, such as the Catenin/Wnt pathway in G1, the ERK pathway in G1 and S, the Nrf2 pathway in S and G2/M and the Akt pathway in G2/M. An important finding was that higher levels of DNA damage in S- and G2/M-enriched cultures correlated with higher levels of CYP1A1 and CYP1B1 mRNA and proteins. Moreover, exposure of synchronised MCF-7 cells to BaP-7,8-diol-9,10-epoxide (BPDE), the ultimate carcinogenic metabolite of BaP, did not result in significant changes in DNA adduct levels at different phases of the cell cycle.
Conclusions: This study characterised the complex gene response to BaP in MCF-7 cells and revealed a strong correlation between the varying efficiency of BaP metabolism and DNA damage in different phases of the cell cycle. Our results suggest that growth kinetics within a target-cell population may be important determinants of susceptibility and response to a genotoxic agent.
© 2011 Hamouchene et al; licensee BioMed Central Ltd.
Figures
Similar articles
-
Inhibitory effects of chrysoeriol on DNA adduct formation with benzo[a]pyrene in MCF-7 breast cancer cells.Toxicology. 2010 Jul-Aug;274(1-3):42-8. doi: 10.1016/j.tox.2010.05.009. Epub 2010 May 27. Toxicology. 2010. PMID: 20553787
-
AHR- and DNA-damage-mediated gene expression responses induced by benzo(a)pyrene in human cell lines.Chem Res Toxicol. 2007 Dec;20(12):1797-810. doi: 10.1021/tx700252n. Epub 2007 Oct 19. Chem Res Toxicol. 2007. PMID: 17944540
-
Tissue specific induction of cytochrome P450 (CYP) 1A1 and 1B1 in rat liver and lung following in vitro (tissue slice) and in vivo exposure to benzo(a)pyrene.Toxicol In Vitro. 2006 Jun;20(4):426-38. doi: 10.1016/j.tiv.2005.08.015. Epub 2005 Sep 28. Toxicol In Vitro. 2006. PMID: 16198082
-
Oral benzo[a]pyrene: understanding pharmacokinetics, detoxication, and consequences--Cyp1 knockout mouse lines as a paradigm.Mol Pharmacol. 2013 Sep;84(3):304-13. doi: 10.1124/mol.113.086637. Epub 2013 Jun 12. Mol Pharmacol. 2013. PMID: 23761301 Free PMC article. Review.
-
Modulation of benzo[a]pyrene-DNA adduct formation by CYP1 inducer and inhibitor.Genes Environ. 2017 Apr 10;39:14. doi: 10.1186/s41021-017-0076-x. eCollection 2017. Genes Environ. 2017. PMID: 28405246 Free PMC article. Review.
Cited by
-
Azadirachtin Attenuates Carcinogen Benzo(a) Pyrene-Induced DNA Damage, Cell Cycle Arrest, Apoptosis, Inflammatory, Metabolic, and Oxidative Stress in HepG2 Cells.Antioxidants (Basel). 2023 Nov 14;12(11):2001. doi: 10.3390/antiox12112001. Antioxidants (Basel). 2023. PMID: 38001854 Free PMC article.
-
Mechanistic relationships between hepatic genotoxicity and carcinogenicity in male B6C3F1 mice treated with polycyclic aromatic hydrocarbon mixtures.Arch Toxicol. 2015 Jun;89(6):967-77. doi: 10.1007/s00204-014-1285-8. Epub 2014 Jun 3. Arch Toxicol. 2015. PMID: 24888377 Free PMC article.
-
Carcinogenic polycyclic aromatic hydrocarbons induce CYP1A1 in human cells via a p53-dependent mechanism.Arch Toxicol. 2016 Feb;90(2):291-304. doi: 10.1007/s00204-014-1409-1. Epub 2014 Nov 15. Arch Toxicol. 2016. PMID: 25398514 Free PMC article.
-
Aryl hydrocarbon receptor ligands in cancer: friend and foe.Nat Rev Cancer. 2014 Dec;14(12):801-14. doi: 10.1038/nrc3846. Nat Rev Cancer. 2014. PMID: 25568920 Free PMC article. Review.
-
The impact of chemotherapeutic drugs on the CYP1A1-catalysed metabolism of the environmental carcinogen benzo[a]pyrene: Effects in human colorectal HCT116 TP53(+/+), TP53(+/-) and TP53(-/-) cells.Toxicology. 2018 Apr 1;398-399:1-12. doi: 10.1016/j.tox.2018.02.006. Epub 2018 Feb 19. Toxicology. 2018. PMID: 29471073 Free PMC article.
References
-
- Miller EC. Some current perspectives on chemical carcinogenesis in humans and experimental animals: Presidential Address. Cancer Res. 1978;38(6):1479–1496. - PubMed
-
- Miller EC, Miller JA. Milestones in chemical carcinogenesis. Semin Oncol. 1979;6(4):445–460. - PubMed
-
- Gooderham NJaC PL. Mechanisms of chemical carcinogenesis. 2002.
Publication types
MeSH terms
Substances
Grants and funding
LinkOut - more resources
Full Text Sources
Molecular Biology Databases
Miscellaneous
