. 2011 Jul 29;286(30):26781-93.
doi: 10.1074/jbc.M110.197947. Epub 2011 Jun 1.

A hypomorphic mutation in Lpin1 induces progressively improving neuropathy and lipodystrophy in the rat

Affiliations

A hypomorphic mutation in Lpin1 induces progressively improving neuropathy and lipodystrophy in the rat

Joram D Mul et al. J Biol Chem. .

Abstract

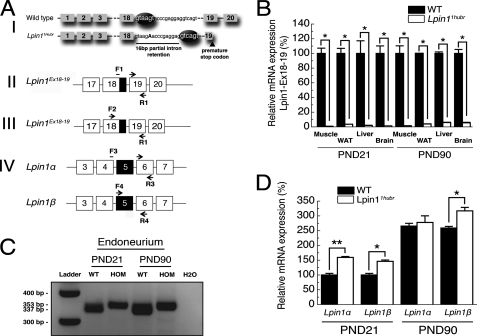
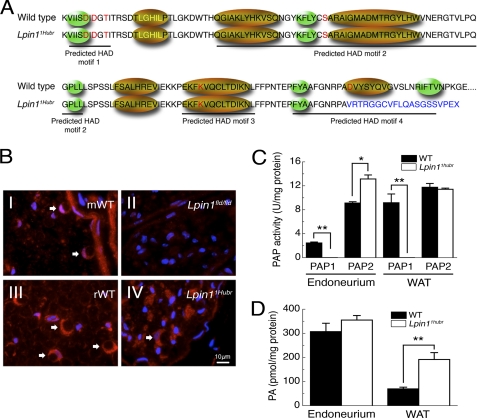
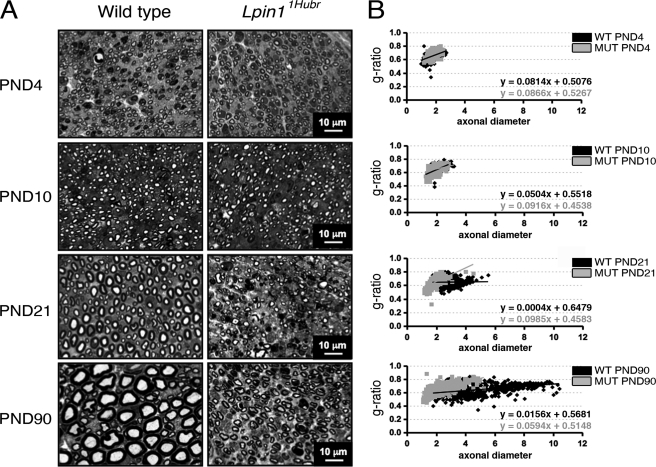
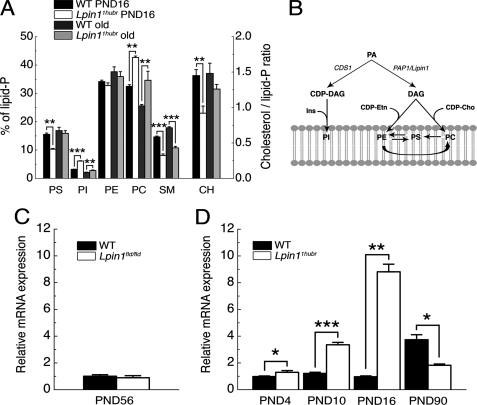
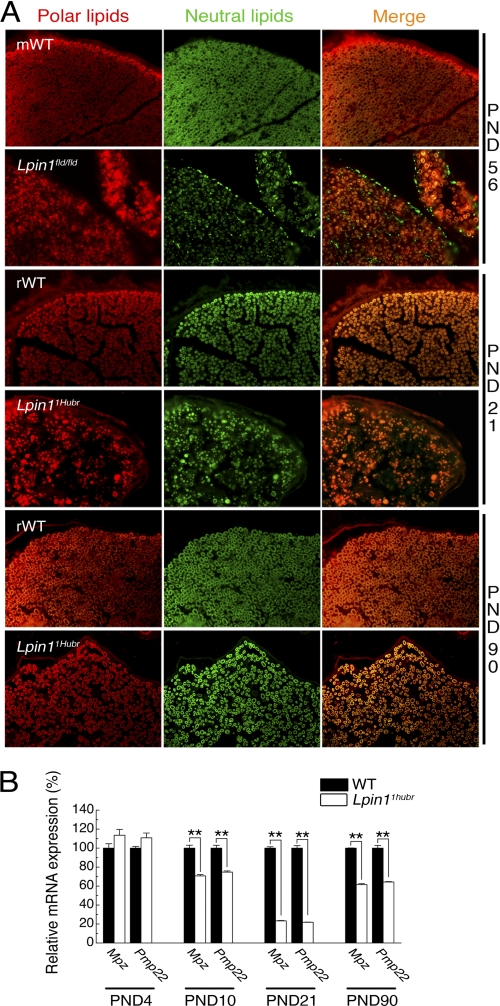
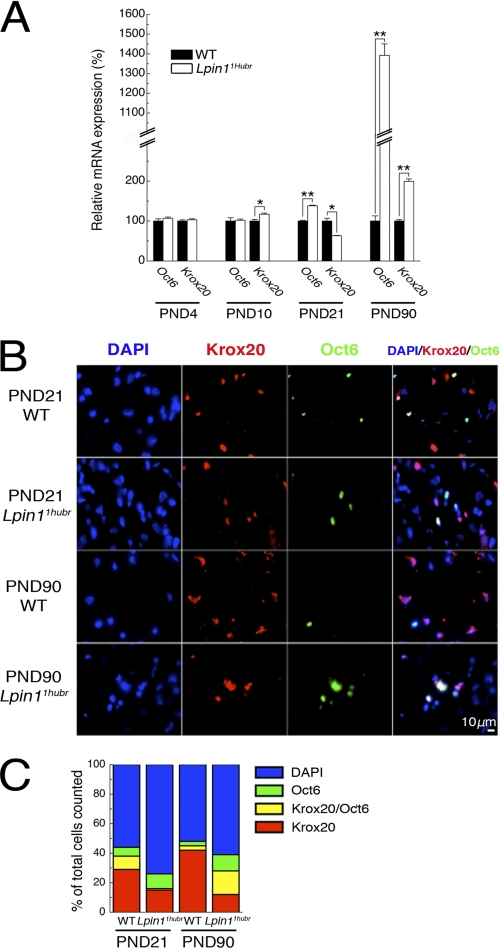
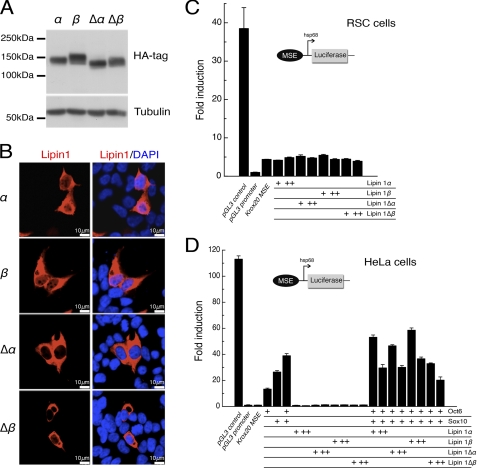
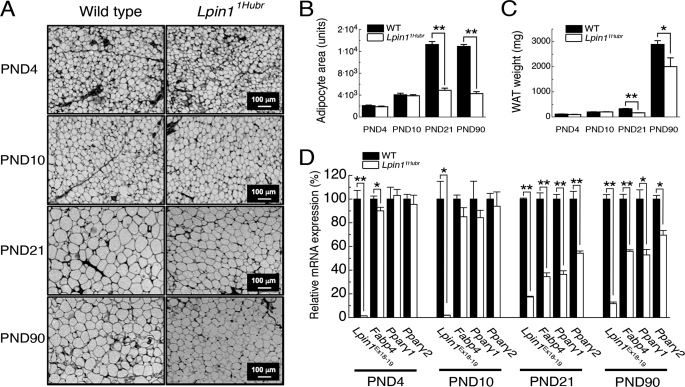
The Lpin1 gene encodes the phosphatidate phosphatase (PAP1) enzyme Lipin 1, which plays a critical role in lipid metabolism. In this study we describe the identification and characterization of a rat model with a mutated Lpin1 gene (Lpin1(1Hubr)), generated by N-ethyl-N-nitrosourea mutagenesis. Lpin1(1Hubr) rats are characterized by hindlimb paralysis and mild lipodystrophy that are detectable from the second postnatal week. Sequencing of Lpin1 identified a point mutation in the 5'-end splice site of intron 18 resulting in mis-splicing, a reading frameshift, and a premature stop codon. As this mutation does not induce nonsense-mediated decay, it allows the production of a truncated Lipin 1 protein lacking PAP1 activity. Lpin1(1Hubr) rats developed hypomyelination and mild lipodystrophy rather than the pronounced demyelination and adipocyte defects characteristic of Lpin1(fld/fld) mice, which carry a null allele for Lpin1. Furthermore, biochemical, histological, and molecular analyses revealed that these lesions improve in older Lpin1(1Hubr) rats as compared with young Lpin1(1Hubr) rats and Lpin1(fld/fld) mice. We observed activation of compensatory biochemical pathways substituting for missing PAP1 activity that, in combination with a possible non-enzymatic Lipin 1 function residing outside of its PAP1 domain, may contribute to the less severe phenotypes observed in Lpin1(1Hubr) rats as compared with Lpin1(fld/fld) mice. Although we are cautious in making a direct parallel between the presented rodent model and human disease, our data may provide new insight into the pathogenicity of recently identified human LPIN1 mutations.


Figures

FIGURE 1.
FIGURE 1.
The Lpin11Hubr mutation disturbs exon 18–19 splicing. A, panel I, ENU mutagenesis introduced a T>A mutation (indicated in capital bold) in intron 18 of Lpin11Hubr rats. The mutation disrupted a splice site motif (GTXAGT), creating a new splice site downstream and resulting in a 16-bp partial intron retention. Black ellipses indicate a splice motif. The new reading frame resulted in a premature stop codon in exon 19. B, relative quantification of the expression of the wild-type transcript in Lpin11Hubr rats at PND 21 and PND 90 (*, p < 0.001; n = 2 per group; primers are shown in A, panel II; black part in primer overview indicates the 16-bp intron retention). C, qualitative analysis of Lpin1 expression revealed the expression of a mutated allele (353 bp) without any residual wild-type allele (337 bp) expression in sciatic nerve tissue of Lpin11Hubr rats as compared with wild-type rats at PND 21 and PND 90 (primers are shown in A, panel III; black part in the primer overview indicates a 16-bp intron retention). H2O was used as a control. D, relative expression of Lpin1α and Lpin1β is increased in sciatic nerve tissue of Lpin11Hubr rats as compared with wild-type rats at PND 21. At PND 90, relative expression of Lpin1α and Lpin1β is unchanged and increased (respectively) in sciatic nerve tissue of Lpin11Hubr rats as compared with wild-type rats (*, p < 0.05; **, p < 0.001; n = 2 per group; primers are shown in A, panel IV). Exon 5 (shown in black in primer overview) is included in Lpin1β, but is absent in Lpin1α. Data are expressed as mean ± S.E.
FIGURE 2.
FIGURE 2.
The Lpin1 PAP1 activity is disrupted in Lpin11Hubr rats. A, amino acid sequence showing the four predicted HAD motifs, the conserved amino acids from the HAD family of proteins are indicated in red letters, the transcription coactivator motif LXXIL in yellow letters, green ellipses indicate predicted β-strands, and gold ellipses indicate predicted α-helices (11). The partial intron retention disrupts the conserved amino acid in the predicted HAD motif IV (WT, GNRPAD; Lpin11Hubr, GNRPAV). Moreover, the out-of-frame translation (indicated in blue) disrupts the predicted α-helix and the second predicted β-strand of the predicted HAD motif IV. B, immunolabeling of Lipin 1 (red) and 4′,6-diamidino-2-phenylindole (DAPI; blue) in cross-sections of sciatic nerve derived from wild-type (mWT; B, panel I) or Lpin1fld/fld mice at PND 56 (B, panel II), and derived from wild-type (rWT; B, panel III), or Lpin11Hubr rats (B, panel IV) at PND 90. The endoneurial part of the control nerves shows the expression of Lipin 1 in myelinating Schwann cells (red-stained croissant-shaped cells indicated by white arrows). This labeling is completely absent in Lpin1fld/fld mice but partially preserved in Lpin11Hubr rats. C, PAP1 activity is substantially decreased in sciatic nerve endoneurium and WAT of Lpin11Hubr rats as compared with wild-type rats at PND 21. PAP2 activity is increased in sciatic nerve endoneurium of Lpin11Hubr rats as compared with wild-type rats, whereas no significant difference in WAT PAP2 activity was observed between genotypes (*, p < 0.005; **, p < 0.001; n = 5–6 per group). D, at PND 21, PA levels were unchanged in sciatic nerve and increased in WAT tissue of Lpin11Hubr rats as compared with wild-type rats (*, p < 0.001; n = 6 per group). Data are expressed as mean ± S.E.
FIGURE 3.
FIGURE 3.
Progression of myelination in Lpin11Hubr rats. A, toluidine blue-stained semi-thin sections from the medial region of the sciatic nerve of Lpin11Hubr and wild-type rats at PND 4, 10, 21, and 90. At PND 4 and 10, the level of myelination is similar in wild-type and mutant nerve. At PND 21 and 90, hypomyelination is visible in sciatic nerves of Lpin11Hubr rats compared with wild-type nerves. At PND 90, the general morphology of Lpin11Hubr sciatic nerves is improved as compared with the general morphology of sciatic nerves isolated from Lpin11Hubr rats at PND 21. B, at PND 4 and 10, average g-ratio, g-ratio trend line, and average axonal diameter of medial sciatic nerve tissue is equal between genotypes. At PND 21 and PND 90, axons of Lpin11Hubr rats (MUT) show a decreased axonal diameter as compared with wild-type (WT) axons, and an aberrant g-ratio trend line indicating hypomyelination. Axons of Lpin11Hubr rats, however, show an improvement in trend line at PND 90 as compared with PND 21, indicative of partial myelination recovery (PND 4, 10, 21, and 90; n = 2, n = 2, n = 2, and n = 1 per group, respectively; n = 107–374 axons per genotype).
FIGURE 4.
FIGURE 4.
Sciatic nerve lipid composition in the Lpin11Hubr rat. A, the amounts of different lipid classes (see B for legend) as percentage of the total amount in lipid extracts derived from control (WT) and Lpin11Hubr rats at PND 16 or between PND 200 and 300 (“old”; n = 4). B, schematic overview of one part of membrane lipid synthesis in mammals (adapted from Ref. 27). DAG, diacylglycerol; Ins, inositol; CDP-Etn, cytidine diphosphate ethanolamine; CDP-Cho, cytidine diphosphate choline; Cds1, CDP-diacylglycerol synthase gene; CH, cholesterol. C, relative gene expression of Cds1 in sciatic nerve tissue of Lpin1fld/fld mice as compared with wild-type mice at PND 56 (n = 4). D, relative gene expression of Cds1 in sciatic nerve tissue of Lpin11Hubr rats as compared with wild-type rats at PND 4, 10, 16, and 90 (n = 3, n = 3, n = 3, and n = 2 per group, respectively, *, p < 0.05; **, p < 0.01; ***, p < 0.0001). Data are expressed as mean ± S.E.
FIGURE 5.
FIGURE 5.
PNS nerves are hypomyelinated in Lpin11Hubr rats. A, Nile Red staining of sciatic nerve sections from wild-type (mWT) and Lpin1fld/fld mice at PND 56, and wild-type (rWT) and Lpin11Hubr rats at PND 21 and 90. Nile Red staining demonstrated that Lpin1fld/fld sciatic nerve specifically accumulates neutral lipids in the perineurium and endoneurium consecutive to demyelination. In the rat, at PND 21, the typical “donut”-like myelin structures present in wild-type sciatic nerve are replaced in Lpin11Hubr nerves by “dot”-like structures probably corresponding to the accumulation of neutral and polar lipids in SCs. Lpin11Hubr nerves partially recover the donut-like myelin staining at PND 90 suggesting the presence of hypomyelination rather than demyelination. B, relative gene expression analysis of Mpz and Pmp22 (mature SC markers) in sciatic nerve tissue of Lpin11Hubr rats as compared with wild-type rats at PND 4, 10, 21 and 90 (n = 3, n = 3, n = 3, and n = 2 per group, respectively, **, p < 0.001). Data are expressed as mean ± S.E.
FIGURE 6.
FIGURE 6.
Myelination status of Schwann cells in Lpin11Hubr peripheral nerve. A, relative gene expression analysis of Oct6 and Krox20 (SC markers) in sciatic nerve tissue of Lpin11Hubr rats as compared with wild-type rats at PND 4, 10, 21, and 90 (n = 3, n = 3, n = 3, and n = 2 per group, respectively; *, p < 0.05; **, p < 0.001). B, sciatic nerve cross-sections of wild-type (WT) and Lpin11Hubr rats at PND 21 and 90 were immunostained with antibodies against transcription factors Krox20 (red) and Oct6 (green). The nuclei were stained with 4′,6-diamidino-2-phenylindole (DAPI; blue). C, the percentage of DAPI+ (blue), Krox20+ (red), Krox20+ and Oct6+ (yellow), and only Oct6+ (green) cells is shown (n = 2 per group). Data are expressed as mean ± S.E.
FIGURE 7.
FIGURE 7.
Lipin 1α or Lipin 1β do not activate expression through the Krox20 MSE. A, HEK293 cells were transfected with vectors expressing rat Lipin 1α, 1β, or its mutated truncated forms, (Δα) and (Δβ), which were detected by Western blot using an anti-HA antibody. B, subcellular localization of HA-tagged rat Lipin 1 variants (red) was examined by confocal microscopy to compare the localization with the nuclear marker DAPI (blue). C and D, luciferase constructs containing the Krox20 myelination-associated enhancer (MSE), and driven by the hsp68 promoter, were co-transfected with expression plasmids encoding mouse Lipin 1α or Lipin 1β or its mutated truncated forms, Lipin 1Δα and Lipin1 Δβ (C), and/or Oct6 and Sox10 (D), in different cell types as indicated. Fold-induction was represented as the luciferase activity over the minimal hsp68 promoter. CMV enhancer/hsp68 promoter luciferase construct (pGL3 control) and the hsp68 promoter luciferase construct (pGL3 promoter) served as controls in these experiments (+, 100 ng/well; ++, 500 ng/well of Lipin 1α, Lipin 1β, Lipin 1Δα or Lipin1 Δβ; +, 200 ng/well of Oct6 and Sox10). Data are expressed as mean ± S.E.
FIGURE 8.
FIGURE 8.
Lipodystrophy phenotype in Lpin11Hubr rats. A, dorsal subcutaneous adipose tissue sections prepared from wild-type and Lpin11Hubr rats at PND 4, 10, 21, and 90 stained with hematoxylin and eosin. Starting from PND 21 the reduced size of adipocytes became visible in Lpin11Hubr samples. B, average adipocyte area is not significantly different between genotypes at PND 4 and 10, but is decreased in Lpin11Hubr rats as compared with wild-type rats at PND 21 and 90 (n = 2 per group; n = 41–83 adipocytes per group; **, p < 0.001). C, dorsal subcutaneous WAT weight is equal between genotypes at PND 4 and 10 (n = 2 per group), but is decreased in Lpin11Hubr rats compared with wild-type rats at PND 21 (n = 2 per group) and PND 90 (n = 2–4 per group; *, p < 0.05; **, p < 0.001). D, relative gene expression analysis in WAT of Lpin1 (Lpin1Ex18–19) and genes involved in adipocyte differentiation (Fabp4, Pparγ1, and Pparγ2) in WAT isolated from wild-type and Lpin11Hubr rats (PND 4, n = 3; PND 10, n = 3; PND 21, n = 5; and PND 90, n = 2 per group, *, p < 0.05; **, p < 0.001). Data are expressed as mean ± S.E.

References

    1. Finck B. N., Gropler M. C., Chen Z., Leone T. C., Croce M. A., Harris T. E., Lawrence J. C., Jr., Kelly D. P. (2006) Cell Metab. 4, 199–210 - PubMed
    1. Nadra K., de Preux Charles A. S., Médard J. J., Hendriks W. T., Han G. S., Grès S., Carman G. M., Saulnier-Blache J. S., Verheijen M. H., Chrast R. (2008) Genes Dev. 22, 1647–1661 - PMC - PubMed
    1. Verheijen M. H., Chrast R., Burrola P., Lemke G. (2003) Genes Dev. 17, 2450–2464 - PMC - PubMed
    1. Phan J., Reue K. (2005) Cell Metab. 1, 73–83 - PubMed
    1. Donkor J., Sariahmetoglu M., Dewald J., Brindley D. N., Reue K. (2007) J. Biol. Chem. 282, 3450–3457 - PubMed

Publication types

MeSH terms