. 2011 Aug 18;118(7):1784-96.
doi: 10.1182/blood-2011-01-333179. Epub 2011 Jun 28.

AF1q/MLLT11 regulates the emergence of human prothymocytes through cooperative interaction with the Notch signaling pathway

Affiliations

AF1q/MLLT11 regulates the emergence of human prothymocytes through cooperative interaction with the Notch signaling pathway

Aude Parcelier et al. Blood. .

Abstract

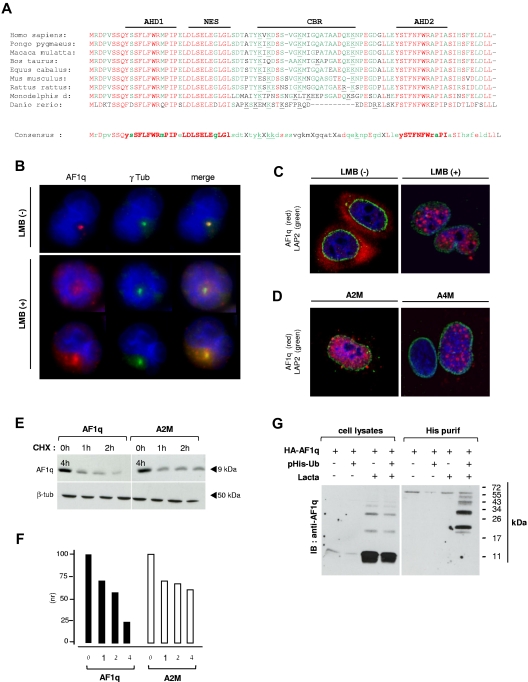
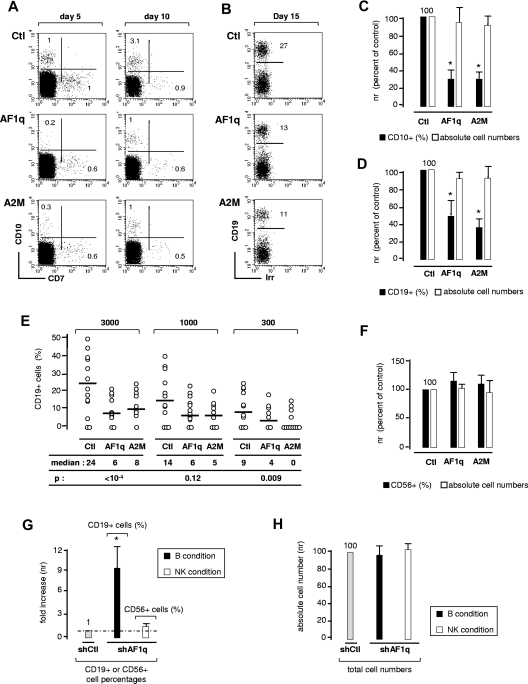
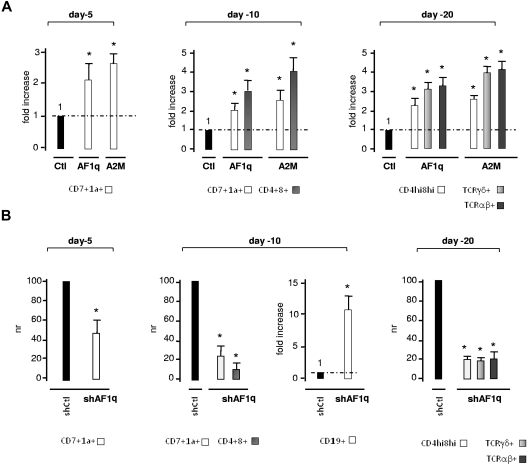
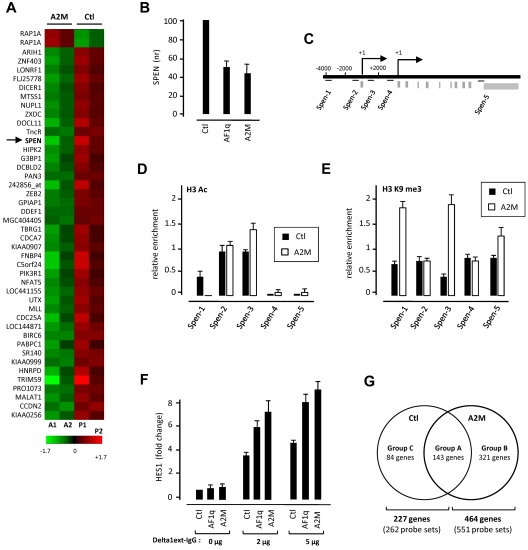
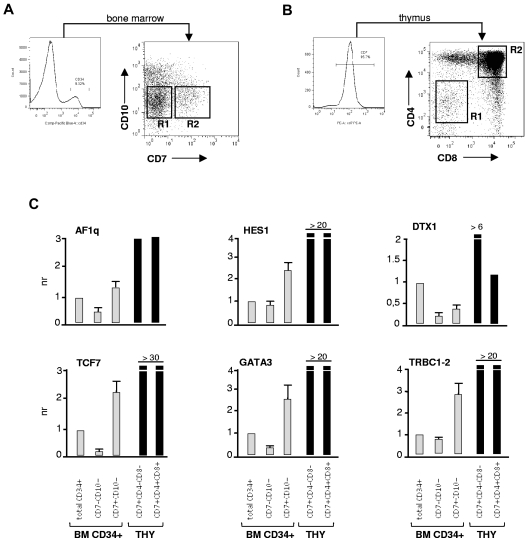
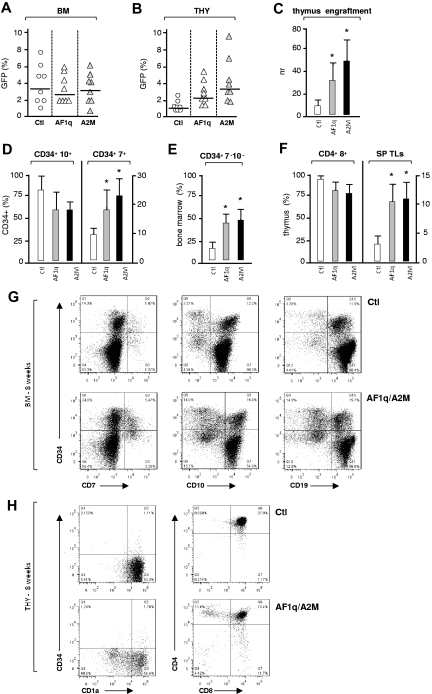
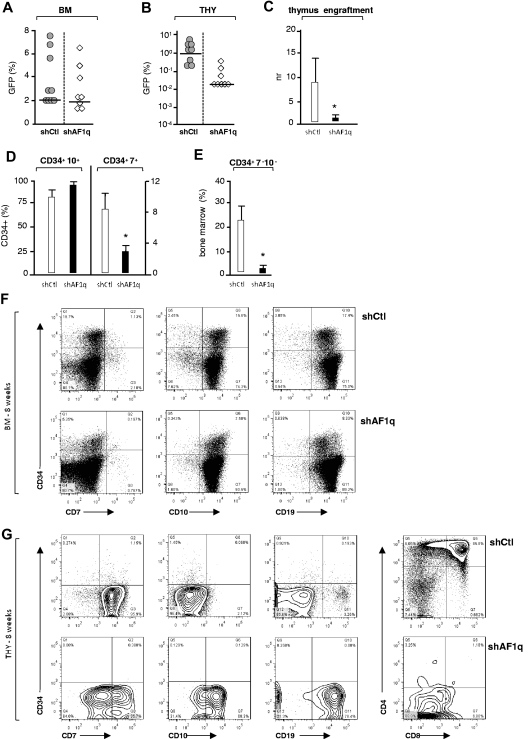
The mechanisms regulating the emergence of BM prothymocytes remain poorly characterized. Genome-wide transcriptome analyses looking for genes expressed in human prothymocytes led to the identification of AF1q/MLLT11 as a candidate gene conceivably involved in this process. Analysis of AF1q protein subcellular localization and intracellular trafficking showed that despite pronounced karyophily, it was subjected to constitutive nuclear export followed by ubiquitin-mediated degradation in the centrosomal area. Using in vitro assays based on either forced expression or shRNA-mediated silencing of AF1q, we provide evidence that the protein promotes T- over B-cell differentiation in multipotent hematopoietic progenitors. At the molecular level, AF1q confers to multipotent progenitors an increased susceptibility to Delta-like/Notch-mediated signaling. Consistent with these findings, enforced AF1q expression in humanized mice fosters the emergence of BM CD34(+)CD7(+) prothymocytes, enhances subsequent thymus colonization, and accelerates intrathymic T-cell development. In contrast, AF1q silencing provokes a global shift of BM lymphopoiesis toward the B-cell lineage, hinders prothymocyte development, inhibits thymus colonization, and leads to intrathymic accumulation of B cells. Our results indicate that AF1q cooperates with the Notch signaling pathway to foster the emergence of BM prothymocytes and drive subsequent intrathymic specification toward the T-cell lineage.


Figures

Figure 1
Figure 1
Intracellular trafficking and ubiquitin-dependent catabolism of AF1q by the proteasome. (A) Comparison of the amino acid sequence of AF1q orthologs. The AF1q AHD1 and AHD2, NES, and CBR are indicated. ClustalW alignments were performed using the Accelrys Gene v2.5 software. Conserved amino acids are shown in red; consensus residues are in green. Synonymous amino-acid substitutions are indicated in lower-case letters; conserved basic residues of the CBR are underlined. (B) The centrosomal localization of AF1q follows its nuclear export. SupT1 cells were treated with 2 ng/mL of LMB for 2 hours before labeling with AF1q (red) and γ-tubulin (green) antibodies. (C-D) Subcellular localization of wild-type AF1q and of its Δ-NES L30/32A (A2M) or L27/29/30/32A (A4M) mutant derivatives. HeLa cells were transfected with vectors encoding HA-tagged AF1q (C) or the mutant proteins (D). Cells were treated or not with 2 ng/mL of LMB for the last 2 hours and labeled with AF1q (red) and LAP2 (green) antibodies. LAP-2 is a marker of the inner nuclear envelope. Confocal microcopy analysis was performed 48 hours after transfection. (E-F) Constitutive nuclear relocation of AF1q slows down its catabolism. HEK-AF1q (right panel) and HEK-A2M cell lines (left panel) were treated for the indicated periods with CHX and analyzed by immunoblot (E) followed by protein quantification by densitometry (F). Results are normalized relative to protein levels detected in control cells cultured under the same conditions but without CHX. (G) AF1q degradation depends on its prior ubiquitylation. HEK-AF1q cells were transfected or not with a His-tagged ubiquitin (6xHis-Ubiquitin) vector, and treated or not with 10μM Lactacystin (Lacta) for 12 hours before immunoblotting with AF1q antibodies. Left panel shows total cell extracts; right panel, His-purified proteins.
Figure 2
Figure 2
Effect of AF1q on B-cell differentiation. (A,C) AF1q antagonizes the emergence of CD7CD10+ pre-pro-B cells in serum-free cultures. CD34+Lin HPCs were transduced with AF1q, A2M, or the empty vector (Ctl), sorted based on GFP expression, and cultured for 5-11 days with SCF, FLT3L, TPO, and IL-7 under serum-free conditions. (A) Flow cytometry dot-plots of GFP+-gated cells. Numbers in quadrants indicate the percentage of each population. Data are from 1 of 4 independent experiments. (C) Relative quantification of the effect exerted by AF1q or A2M on CD7CD10+ pre-pro-B-cell differentiation or overall cell proliferation. To limit experimental variability due to donor effect, results are normalized relative to CD10+ cell percentages and absolute cell numbers in cultures of empty vector–transduced cells (Ctl). Data are means ± SD percentages of 4 independent experiments. Statistically significant differences (P < .05, Student t test) in percentages or absolute numbers between AF1q/A2M and the control conditions are marked by asterisks. (B,D) AF1q antagonizes B-cell development in cocultures onto MS5 cells. (B) CD34+ HPCs transduced as above with AF1q, A2M, or the empty vector were seeded onto MS5 cells and cultured for 2 weeks in the absence of exogenous cytokines before absolute cell numbers and CD19+GFP+ B-cell percentages were determined. Data are representative of 1 of 4 independent experiments. (D) Relative quantification of the effect exerted by AF1q and A2M on B-cell development (CD19+ B-cell percentages) or global cell expansion (total cell numbers); results are normalized relative to percentages of CD19+ cells and absolute cell numbers in cultures of empty vector–transduced cells (Ctl). Irr indicates irrelevant antibody. Data are means ± SD percentages of 4 independent experiments. Statistically significant differences are indicated. (E) Limiting-dilution analysis. CD34+ HPCs were transduced and cultured as above. Positive wells were scored on day 14 and analyzed by FACS as indicated above. Empty circles represent CD19+ B-cell percentages. FACS analysis was restricted to cell-containing wells. Medians and P values are indicated. Statistical significance was determined by the Wilcoxon test. (F) AF1q does not affect NK-cell development. CD34+ HPCs transduced with AF1q, A2M, or the empty vector and sorted as above were seeded onto MS5 cells and cultured for 3 weeks with SCF, FLT3L, IL-2, IL-7, and IL-15 before absolute cell numbers and CD56+GFP+ NK-cell percentages were determined. Results are normalized relative to CD56+ cell percentages and absolute cell numbers in cultures of empty vector–transduced cells (Ctl). Means ± SD percentages of 4 independent experiments are shown. (G-H) AF1q deficiency enhances B-cell differentiation. CD34+ HPCs transduced with lentiviral vectors driving the expression of shRNA54 (shAF1q) or scrambled shRNAs (shCtl) were seeded onto MS5 cells and cultured under conditions that promote B-cell (black bars) or NK-cell (empty bars) development. CD19+ and CD56+ cell percentages (G) and absolute numbers (H) were determined by FACS. Results are normalized relative to the control condition (shCtl). Means ± SD of 4 independent experiments are shown. Statistically significant differences are indicated.
Figure 3
Figure 3
Effect of AF1q on the kinetics of T-cell development in OP9-DL1 cell cocultures. (A) Forced expression of AF1q promotes T-cell development. CD34+CD45RALin HPCs transduced with AF1q, A2M, or the empty vector (Ctl) were sorted based on GFP expression and cultured onto OP9-DL1 cells with SCF, FLT3L, and IL-7. GFP+ cells were FACS analyzed at the indicated time points for determining the percentages of CD7+CD1a, CD7+CD1a+, CD4+CD8+, CD4+CD8hi, TCRαβ+, and TCRγδ+ cells. Results are normalized relative to percentages in cultures of empty vector–transduced cells (Ctl), and are presented as -fold increases. Means ± SD percentages of 4 independent experiments are shown. Statistically significant differences (P < .05; Student t test) between AF1q/A2M and the control conditions are marked by asterisks. Note that AF1q/A2M did not significantly affect overall cell yields (data not shown). The corresponding dot-plot analyses are shown in supplemental Figure 5A. (B) AF1q deficiency impairs T-cell development. CD34+CD45RALin HPCs transduced with vectors driving the expression of AF1q-specific shRNA54 (shAF1q) or scrambled shRNAs (shCtl) were seeded onto OP9-DL1 cells, cultured, and processed as described. Results are normalized relative to percentages in cultures of cells transduced with scrambled shRNAs (shCtl), and are presented as normalized ratios (NR) or -fold increase. Means ± SD percentages of 4 independent experiments are shown. Statistically significant differences are indicated. Dot-plot analyses are presented in supplemental Figure 5B. Note also that AF1q deficiency does not affect cell proliferation (data not shown).
Figure 4
Figure 4
AF1q potentiates Notch signaling. (A) Gene-expression profiling of CD34+CD45RALin HPCs transduced with nuclear-sequestered AF1q (A2M). CD34+CD45+Lin HPCs were FACS sorted, exposed to A2M (A1-A2) or control (P1-P2) vectors, sorted based on GFP expression, and subjected to global gene-expression analysis 72 hours later. Results are from 2 independent experiments (Exp1: A1/P1; Exp2: A2/P2). Statistical analysis, performed with the R package “locfdr” (lfdr < 2%), showed that 44 probe sets were differentially expressed between A2M (A1-A2)- and empty vector (P1-P2)–transduced CD34+CD45RALin HPCs. Results are presented as a heat map of the average expression levels (up: red; down: green). (See also supplemental Table 2.) (B) AF1q down-modulates SPEN transcript levels in CD34+CD45RALin HPCs. qRT-PCR analysis of CD34+CD45RALin cells transduced with AF1q, A2M, or the empty vector (Ctl). Expression levels (nr) are normalized relative to those in cells transduced with the empty vector. Means ± SD percentages of 3 independent experiments are shown. (C-E) AF1q induces histone H3 modifications at the Spen locus. (C) Diagram illustrating the genomic context of Spen promoter loci. Regions amplified by site-specific qPCR are indicated by bars. (D-E) CD34+CD45RALin cells were transduced as above with A2M or the empty vector and cultured for 72 hours before ChIP analysis via anti-H3ac (D) and anti-H3K9me3 (E) antibodies. Results are means of 2 ChIP experiments analyzed in triplicate. (F-G) Forced AF1q expression broadens the repertoire of Notch-responsive genes in CD34+CD45RALin HPCs. (F) CD34+CD45RALin HPCs were transduced with AF1q, A2M, or the empty vector (Ctl), sorted based on GFP expression, and cultured for 3 more days onto graded doses of plastic-immobilized Delta1ext-IgG before qRT-PCR analysis. Expression levels are normalized relative to those in cells transduced with the empty vector. Means ± SD of 3 independent samples are shown. (G) Venn diagram detailing shared and distinct gene expression between Notch-stimulated A2M- and empty vector–transduced cells. CD34+CD45RALin HPCs were transduced with A2M or the empty vector (Ctl), and cultured as above before being subjected to global gene-expression analysis. Statistical analysis performed with the R package “locfdr” (lfdr < 5%) showed that, after Notch activation, 551 probe sets were up-regulated in A2M-transduced cells, relative to only 262 for their homologs transduced with the empty vector (see also supplemental Table 5A-D).
Figure 5
Figure 5
Phenotypic characterization of early lymphoid progenitors in humanized mice. (A-B) Gating procedures. Irradiated NSG mice were injected intravenously with CD34+ HPCs (1.5 × 10⁵ cells), and the BM and thymus were harvested 8 weeks later. Single-cell suspensions obtained from 3 mice were pooled and labeled with the corresponding antibodies. Gates are set on human CD45+ cells. (A) CD34++ BM cells were sorted based on CD7 and CD10 expression. (B) Thymocytes were sorted based on CD7, CD4, and CD8 expression. The corresponding cell populations were then analyzed by qRT-PCR. (C) qRT-PCR analysis of sorted CD34+CD7CD10 and CD34+CD7+CD10 BM HPCs, and of CD7+CD4CD8 and CD7+CD4+CD8+ thymocytes of recipient mice 8 weeks after grafting (see also supplemental Figure 5B). Expression levels are normalized relative to those detected in total nonfractionated BM CD34+ HPCs. For BM cells, results are means ± SD of 2 independent experiments. For thymocytes, results are from one experiment.
Figure 6
Figure 6
Effect of forced AF1q expression on T-cell development in humanized mice. (A-B) CD34+ HPCs (1.5 × 10⁵ cells) exposed to the AF1q, A2M, or empty vectors were injected intravenously into irradiated NSG mice, and the BM, spleen, and thymus were harvested 8 weeks later. Single-cell suspensions were analyzed by multicolor flow cytometry to determine the extent of CD45+GFP+ chimerism and for phenotyping the cells. Percentages of GFP+ cells among CD45+ human cells present in the BM (A) or the thymus (B) of individual recipient mice are shown (transduction efficiency: 14% ± 2%; 8 mice per condition; 2 experiments). Median percentages are indicated by a horizontal bar. (C) Effect of AF1q or A2M on thymus colonization. The efficiency of thymus engraftment was calculated as the ratio of GFP+CD45+ cell percentages detected in the thymus and BM of individual mice. Statistically significant differences (P < .05; Student t test) between AF1q/A2M and control mice are marked by asterisks. (D-F) Percentages of CD7+ and CD10+ lymphoid precursors (D) or of multipotent CD7CD10 HPCs (E) among CD34+GFP+CD45+ BM cells. (F) percentages of CD4+CD8+ and CD4+/−CD8+/− single-positive T cells among thymic GFP+CD45+ cells. Means ± SD percentages are shown. Statistically significant differences are marked as above. (G-H) Flow cytometric analysis of CD45+GFP+ cells in the BM (H) and thymi (I) of individual mice at week 8 after grafting. Numbers in quadrants indicate the percentages of each population.
Figure 7
Figure 7
Effect of AF1q deficiency on T-cell development in humanized mice. (A-B) NSG mice were injected with CD34+ HPCs (1.5 × 10⁵ cells) exposed to shAF1q or scrambled shRNA vectors and analyzed as described in Figure 6. The percentages of GFP+ cells among CD45+ human cells present in the BM (A) or thymi (B) of individual mice are shown (transduction efficiency: 12% ± 3%; 8 mice per condition, 2 experiments). Median percentages are indicated by a horizontal bar. (C) Effect of AF1q deficiency on thymus colonization. The efficiency of thymus engraftment was calculated and expressed as above. Statistically significant differences are marked by asterisks. (D-E) Percentages of CD7+ and CD10+ lymphoid precursors (D) or of multipotent CD7CD10 HPCs (E) among CD34+GFP+CD45+ BM cells. Statistically significant differences are marked by asterisks. (F-G) Flow cytometric analysis of CD45+GFP+ cells in the BM (F) and thymi (G) of individual mice at week 8 after grafting. Numbers in quadrants indicate the percentages of each population.

Similar articles

Cited by

References

    1. Rodewald HR, Kretzschmar K, Takeda S, Hohl C, Dessing M. Identification of pro-thymocytes in murine fetal blood: T lineage commitment can precede thymus colonization. EMBO J. 1994;13(18):4229–4240. - PMC - PubMed
    1. Awong G, Herer E, Surh CD, Dick JE, La Motte-Mohs RN, Zuniga-Pflucker JC. Characterization in vitro and engraftment potential in vivo of human progenitor T cells generated from hematopoietic stem cells. Blood. 2009;114(5):972–982. - PubMed
    1. Haddad R, Guimiot F, Six E, et al. Dynamics of thymus-colonizing cells during human development. Immunity. 2006;24(2):217–230. - PubMed
    1. Besseyrias V, Fiorini E, Strobl LJ, et al. Hierarchy of Notch-Delta interactions promoting T cell lineage commitment and maturation. J Exp Med. 2007;204(2):331–343. - PMC - PubMed
    1. Koch U, Fiorini E, Benedito R, et al. Delta-like 4 is the essential, nonredundant ligand for Notch1 during thymic T cell lineage commitment. J Exp Med. 2008;205(11):2515–2523. - PMC - PubMed

Publication types

MeSH terms