. 2011 Aug 26;286(34):29621-6.
doi: 10.1074/jbc.M111.236802. Epub 2011 Jun 28.

Partial requirement of endothelin receptor B in spiral ganglion neurons for postnatal development of hearing

Affiliations

Partial requirement of endothelin receptor B in spiral ganglion neurons for postnatal development of hearing

Michiru Ida-Eto et al. J Biol Chem. .

Abstract

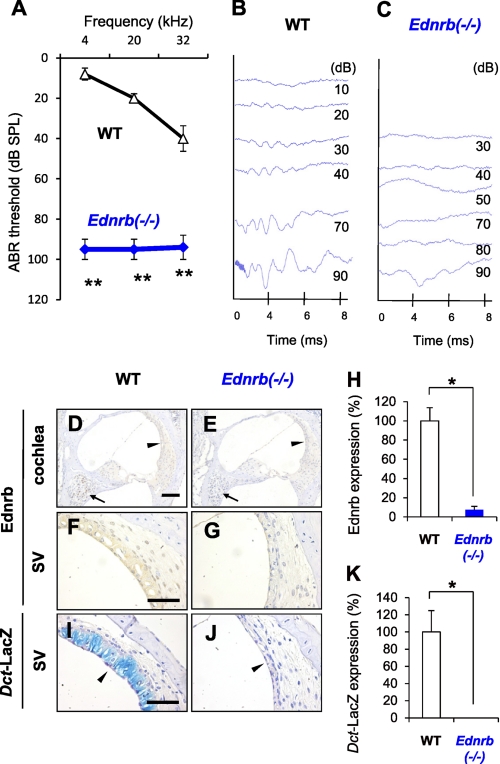
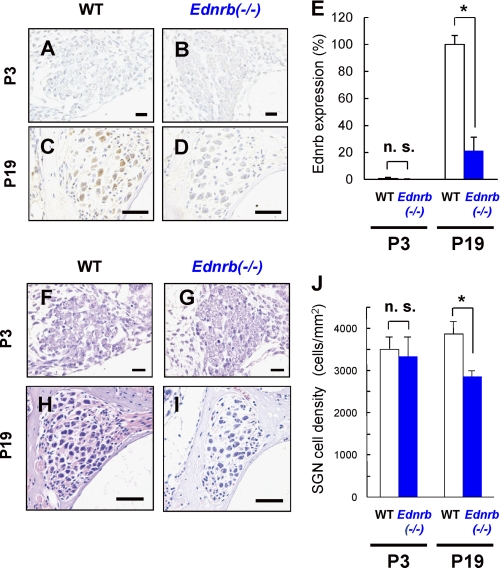
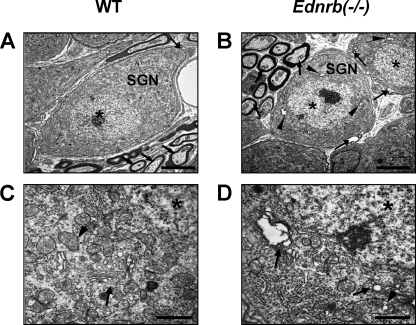
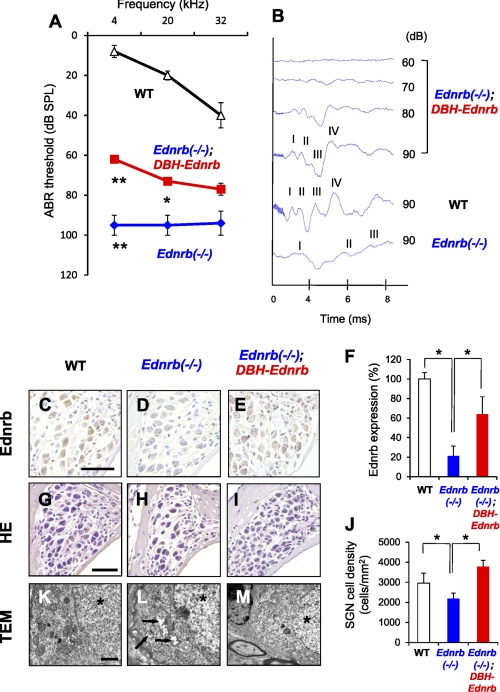
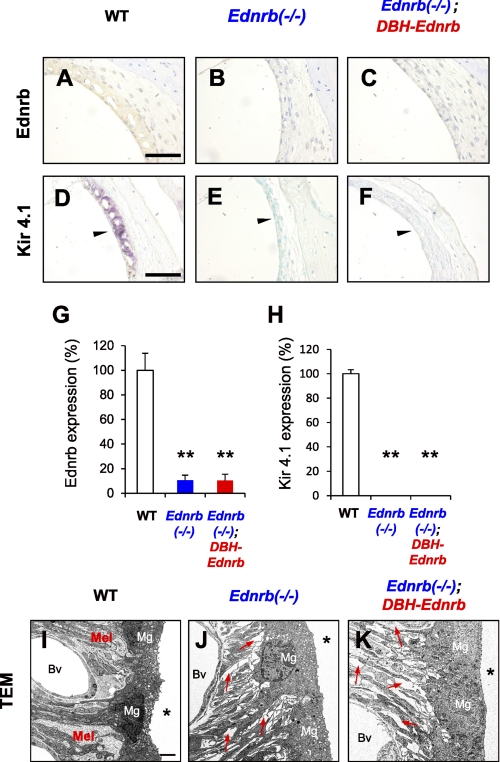
Impairments of endothelin receptor B (Ednrb/EDNRB) cause the development of Waardenburg-Shah syndrome with congenital hearing loss, hypopigmentation, and megacolon disease in mice and humans. Hearing loss in Waardenburg-Shah syndrome has been thought to be caused by an Ednrb-mediated congenital defect of melanocytes in the stria vascularis (SV) of inner ears. Here we show that Ednrb expressed in spiral ganglion neurons (SGNs) in inner ears is required for postnatal development of hearing in mice. Ednrb protein was expressed in SGNs from WT mice on postnatal day 19 (P19), whereas it was undetectable in SGNs from WT mice on P3. Correspondingly, Ednrb homozygously deleted mice (Ednrb(-/-) mice) with congenital hearing loss showed degeneration of SGNs on P19 but not on P3. The congenital hearing loss involving neurodegeneration of SGNs as well as megacolon disease in Ednrb(-/-) mice were markedly improved by introducing an Ednrb transgene under control of the dopamine β-hydroxylase promoter (Ednrb(-/-);DBH-Ednrb mice) on P19. Neither defects of melanocytes nor hypopigmentation in the SV and skin in Ednrb(-/-) mice was rescued in the Ednrb(-/-);DBH-Ednrb mice. Thus, the results of this study indicate a novel role of Ednrb expressed in SGNs distinct from that in melanocytes in the SV contributing partially to postnatal hearing development.


Figures

FIGURE 1.
FIGURE 1.
Congenital deafness in Ednrb−/− mice and expression of Ednrb in inner ears. A, hearing levels (means ± S.E. (error bars)) in WT mice (n = 9) and Ednrb−/− mice (n = 9) on P19 measured by ABR. B and C, ABR waveforms of littermate WT mice (WT, B) and Ednrb−/− mice (Ednrb−/−, C) on P19 at 10–90 dB SPL of 12 kHz sound. D–G, immunohistochemical analysis of Ednrb expression in the cochlea (D and E) and the SV (F and G) from Ednrb−/− mice (E and G) and littermate WT mice (D and F) on P19. Arrows and arrowheads in D and E indicate SGNs and the SV, respectively. H, percentage (means ± S.E.) of Ednrb expression in the SV from Ednrb−/− mice (Ednrb−/−, blue bar, n = 3) and littermate WT mice (WT, white bar, n = 3) to that in the SV from WT mice. I and J, LacZ staining of melanocytes in the SV. We employed Dct-LacZ mice, in which the Dct promoter is known as a specific marker of melanocytes (intermediate cells) (31), to establish Dct-LacZ;Ednrb−/− mice newly by crossing Ednrb−/− mice and Dct-LacZ mice (32). K, percentage (means ± S.E.) of LacZ-positive melanocytes in the SV from Ednrb−/− mice (Ednrb−/−, n = 3) and littermate WT mice (WT, white bar, n = 3) to that in the SV from WT mice. LacZ staining showed no positive cells in the SV from Dct-LacZ;Ednrb−/− mice (arrowhead in J and K), whereas Dct-LacZ mice with intact Ednrb showed LacZ-positive melanocytes in the SV (blue signals indicated by arrowhead in I and K). Significant difference (*, p < 0.05; **, p < 0.01) from the control was analyzed by the Mann-Whitney U test. Scale bars: 100 μm (D and E) and 50 μm (F–J).
FIGURE 2.
FIGURE 2.
Decreased cell density of SGNs in Ednrb−/− mice. A–D, immunohistochemical analyses for serial sections of the levels of Ednrb expression in SGNs from Ednrb−/− mice (B and D) and littermate WT mice (A and C) on P3 (A and B) and P19 (C and D). E, percentage of positive-SGN number (means ± S.E. (error bars)) of Ednrb in Ednrb−/− mice (Ednrb−/−, blue bar, n = 3) and littermate WT mice (WT, white bars, n = 3) on P3 and P19 to that in WT mice on P19. F–I, H&E staining in SGNs at the basal turn from Ednrb−/− mice (G and I) and littermate WT mice (F and H) on P3 (F and G) and P19 (H and I). Scale bars: 20 μm (A, B, F, and G) and 50 μm (C, D, H, and I). J, cell density (means ± S.E.) of SGNs from littermate WT mice (white bars) and Ednrb−/− mice (blue bars) on P3 and P19. Significant difference (*, p < 0.05) from the control was analyzed by the Mann-Whitney U test. n.s., not significant.
FIGURE 3.
FIGURE 3.
Neurodegeneration of SGNs in Ednrb−/− mice. TEM of SGNs from Ednrb−/− mice (B and D) and littermate WT mice (A and C) on P16. A and B, gap areas (arrows in B) between SGNs (SGN in B) and Schwann cells were observed in Ednrb−/− mice but not in littermate WT mice (arrow in A). C and D, vacuolar degeneration of the Golgi apparatus (arrows in D) and mitochondria (arrowhead in D) in SGNs from Ednrb−/− mice and intact morphology of the Golgi apparatus (arrow in C) and mitochondria (arrowhead in C) from WT mice. Asterisks indicate nuclei. Scale bars: 5 μm (A and B) and 1 μm (C and D).
FIGURE 4.
FIGURE 4.
Improvements of hearing levels in Ednrb−/− mice by DBH-Ednrb transgene. A, hearing levels (means ± S.E. (error bars)) in WT (n = 9), Ednrb−/− (n = 9), and Ednrb−/−;DBH-Ednrb mice (n = 12) on P19 measured by ABR. B, ABR waveforms of littermate WT, Ednrb−/−, and Ednrb−/−;DBH-Ednrb mice on P19 at 12-kHz sound. ABR wave peaks correspond to cochlear nerve activity (wave I) and downstream neural activities (waves II-–IV) (33, 34). C–E, immunohistochemical analysis of Ednrb expression in SGNs from WT (C), Ednrb−/− (D), and Ednrb−/−;DBH-Ednrb mice (E) on P19. F, percentage of positive SGN number (means ± S.E.) of Ednrb in Ednrb−/− mice (Ednrb−/−, blue bar, n = 3), Ednrb−/−;DBH-Ednrb mice (Ednrb−/−;DBH-Ednrb, red bar, n = 3) and littermate WT mice (WT, white bar, n = 3) to that in WT mice. G–I, H&E staining in SGNs at the basal turn from WT (G), Ednrb−/− (H), and Ednrb−/−;DBH-Ednrb mice (I) on P19. J, cell density (means ± S.E.) of SGNs from WT, Ednrb−/−, and Ednrb−/−;DBH-Ednrb mice on P19. K–M, TEM of SGNs from WT (K), Ednrb−/− (L), and Ednrb−/−;DBH-Ednrb mice (M) on P16. Vacuolar degeneration in SGNs from Ednrb−/− mice (arrows in L) was not observed in Ednrb−/−;DBH-Ednrb mice (M). Asterisks indicate nuclei (K–M). Scale bars: 50 μm (C–E, G–I), 1 μm (K–M). Significant difference (*, p < 0.05; **, p < 0.01) from the control was analyzed by the Mann-Whitney U test.
FIGURE 5.
FIGURE 5.
Melanocyte defect in the SV from Ednrb−/− mice was not rescued in Ednrb−/−;DBH-Ednrb mice. A–C, immunohistochemical analysis of Ednrb expression in the SV from WT mice (A), Ednrb−/− mice (B), and Ednrb−/−;DBH-Ednrb mice (C) on P19. D–F, immunohistochemical analysis of Kir4.1 expression, which is known as one of the melanocyte markers in the SV (27). Kir4.1-expressing cells were found in WT mice (purple signals indicated by arrowhead in D) but were not found in Ednrb−/− mice and Ednrb−/−;DBH-Ednrb mice (E and F). The methods used for staining are described in detail under “Experimental Procedures.” G and H, percentage (means ± S.E. (error bars)) of Ednrb (G) and Kir4.1 (H) expression levels in the SV from Ednrb−/− mice (Ednrb−/−, blue bar, n = 3), Ednrb−/−;DBH-Ednrb mice (Ednrb−/−;DBH-Ednrb, red bar, n = 3) and littermate WT mice (WT, white bar, n = 3) to that in the SV from WT mice. Significant difference (*, p < 0.05; **, p < 0.01) from the control was analyzed by the Mann-Whitney U test. I–K, TEM of the SV from Ednrb−/− mice (J), Ednrb−/−;DBH-Ednrb mice (K), and littermate WT mice (I) on P19. WT mice exhibited melanocytes (Mel in I) among marginal cells (Mg in I) and blood vessels (Bv in I), whereas Ednrb−/− mice and Ednrb−/−;DBH-Ednrb mice exhibited no melanocytes and many gaps (indicated by red arrows in J and K) among marginal cells (Mg in J and K) and blood vessels (Bv in J and K). Asterisk indicates endolymphatic space (I–K). Scale bars: 50 μm (A–F), 2 μm (I–K).

References

    1. Pardono E., van Bever Y., van den Ende J., Havrenne P. C., Iughetti P., Maestrelli S. R., Costa F. O., Richieri-Costa A., Frota-Pessoa O., Otto P. A. (2003) Am. J. Med. Genet. A 117A, 223–235 - PubMed
    1. Pingault V., Bondurand N., Kuhlbrodt K., Goerich D. E., Préhu M. O., Puliti A., Herbarth B., Hermans-Borgmeyer I., Legius E., Matthijs G., Amiel J., Lyonnet S., Ceccherini I., Romeo G., Smith J. C., Read A. P., Wegner M., Goossens M. (1998) Nat. Genet. 18, 171–173 - PubMed
    1. Edery P., Attié T., Amiel J., Pelet A., Eng C., Hofstra R. M., Martelli H., Bidaud C., Munnich A., Lyonnet S. (1996) Nat. Genet. 12, 442–444 - PubMed
    1. Puffenberger E. G., Hosoda K., Washington S. S., Nakao K., deWit D., Yanagisawa M., Chakravart A. (1994) Cell 79, 1257–1266 - PubMed
    1. Hosoda K., Hammer R. E., Richardson J. A., Baynash A. G., Cheung J. C., Giaid A., Yanagisawa M. (1994) Cell 79, 1267–1276 - PubMed

Publication types

Substances

LinkOut - more resources