. 2011 Oct;39(18):8187-99.
doi: 10.1093/nar/gkr534. Epub 2011 Jun 28.

Flexible tethering of primase and DNA Pol α in the eukaryotic primosome

Affiliations

Flexible tethering of primase and DNA Pol α in the eukaryotic primosome

Rafael Núñez-Ramírez et al. Nucleic Acids Res. 2011 Oct.

Erratum in

  • Nucleic Acids Res. 2012 May;40(10):4726

Abstract

The Pol α/primase complex or primosome is the primase/polymerase complex that initiates nucleic acid synthesis during eukaryotic replication. Within the primosome, the primase synthesizes short RNA primers that undergo limited extension by Pol α. The resulting RNA-DNA primers are utilized by Pol δ and Pol ε for processive elongation on the lagging and leading strands, respectively. Despite its importance, the mechanism of RNA-DNA primer synthesis remains poorly understood. Here, we describe a structural model of the yeast primosome based on electron microscopy and functional studies. The 3D architecture of the primosome reveals an asymmetric, dumbbell-shaped particle. The catalytic centers of primase and Pol α reside in separate lobes of high relative mobility. The flexible tethering of the primosome lobes increases the efficiency of primer transfer between primase and Pol α. The physical organization of the primosome suggests that a concerted mechanism of primer hand-off between primase and Pol α would involve coordinated movements of the primosome lobes. The first three-dimensional map of the eukaryotic primosome at 25 Å resolution provides an essential structural template for understanding initiation of eukaryotic replication.


Figures

Figure 1.
Figure 1.
Biochemical reconstitution and electron microscopy analysis of the yeast primosome. (A) Cartoons of the different constructs used in this work. (B) Gel filtration chromatography of the reconstituted primosome prior to preparation of EM grids and SDS–PAGE analysis of peak fractions. The molecular weight of each subunit is indicated. (C) Representative electron micrographs obtained from a gel-filtered primosome sample. Selected raw particles are highlighted within squares. Scale bar represents 20 nm. (D) Reference-free 2D averages obtained from the EM images of the primosome (left panel) compared to projections of the Pol α–B subunit complex map (12) (right panel). Scale bar represents 15 nm. (E) 3D reconstruction of one conformation of the primosome, obtained after classification of a moderately homogenous subset of particles. A difference map between the primosome and the Pol α–B subunit complex (12) is represented as a green mesh superimposed to the structure of the Pol α–B subunit complex (see text for details of experimental procedure). This difference mapping defines the overall subunit organization in the primosome (right bottom panel).
Figure 2.
Figure 2.
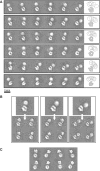
Conformational flexibility of the eukaryotic primosome. (A) Collection of 2D reference-free averages of the primosome. Each row shows a set of averages where the Pol lobe is oriented according to the same view. The conformational flexibility of the primosome is highlighted by a cartoon outline showing the superposition of all averages in a row. Scale bar represents 15 nm. (B) Three selected class averages in panel A were further classified to demonstrate the degree of rotational heterogeneity still present in the average: the position of the Prim lobe is determined by a combination of tilt and rotation relative to the Pol lobe. (C) Reference-free classification of the data set after masking out the information of the Pol lobe. Alignment of the Prim lobe results in blurring of the Pol lobe, an additional indication of the high degree of interlobe flexibility of the primosome. (See also Supplementary Movie S1–S6).
Figure 3.
Figure 3.
Geometric analysis of the yeast primosome. (A) 2D averages of the primosome can be approximated as two circular lobes connected by a flexible linker. Depicted in the Pol lobe is the structure of a related archaeal polymerase (unpublished PDB entry: 3A2F). The flexibility can be characterized by the geometrical parameters d for interlobe distance, α for the interlobe angle in a set of related averages and l for linker size. (B) Geometrical outlines of the 36 2D averages of the yeast primosome in Figure 2A. For each set, the average interlobe distance d, the interlobe angle α and the estimated size of the interlobe linker l are reported. (C) Multiple sequence alignment of the amino acid sequence linking the polymerase domain of Pol α to its carboxy-terminal domain (αCTD) (Hsa: Homo sapiens; Xla: Xenopus laevis; Dme: Drosophila melanogaster; Osa: Oryza sativa; Sce: Saccharomyces cerevisiae). The boundaries for the polymerase domain and the αCTD were determined based on the crystal structures of yeast Pol δ (37) and yeast αCTD (12), respectively. Identical amino acids are highlighted in blue and conserved amino acids in green.
Figure 4.
Figure 4.
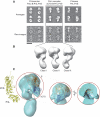
3D structure of yeast Prim complex. (A) Selected reference-free 2D averages and the corresponding raw images of the different complexes after observation in the electron microscope, shown at identical magnification. Bar represents 15 nm. (B) 3D-structures of the Prim complex obtained by maximum-likelihood methods (see text for details). (C) Fitting of the αCTD–B subunit complex in the density of the Prim complex. The αCTD and B subunits are shown as blue and orange ribbon, respectively. The density of the Prim complex is in cyan. The crystal structure of a truncated form of the heterodimeric archaeal primase from Sulfolobus solfataricus (PDB: 1ZT2) is shown as yellow ribbon next to the Prim complex density. (‘B’–B subunit).
Figure 5.
Figure 5.
Functional analysis of yeast primosome. The primer capping assay measures the efficiency of ddATP addition to the RNA primer by Pol α's catalytic domain (Pol αcat), as part of the primosome or when added in trans to the Prim complex. Lane 1: primosome activity in the presence of ATP (control); lane 2: primosome activity in the presence of ATP and ddATP; lane 3; Prim complex activity in the presence of ATP (control); lane 4: Prim complex activity in the presence of ATP and ddATP (control); lanes 5–7: Prim complex activity in the presence of ATP, ddATP and increasing amounts of Pol αcat, in stoichiometric ratios of 1:1, 1:2 and 1:3. The asterisks mark the first appearance of an RNA primer capped with ddATP for the primosome and the Prim complex.
Figure 6.
Figure 6.
Structural and functional analysis of the PriL-CTD. (A) 2D reference-free averages of the Prim complex and the PrimΔLCTD complex. The putative position of the PriL-CTD in the Prim complex is indicated by an arrow. (B) Functional analysis of the Prim complex. The ability of the Prim complex to synthesise an RNA primer was compared to that of the PrimΔLCTD when the PriL-CTD was added in trans to the reaction, in stoichiometric ratios of 1:1, 1:5 and 1:10. The band position marked by the asterisk is a gel artifact caused by the gel running dye. (C) GST pull-down analysis of the interaction between PriL-CTD and the αCTD–B subunit complex. The top panel shows the Coomassie staining of the gel and the bottom panel the western blot with anti-His antibodies. The asterisk marks the position of the GST protein.
Figure 7.
Figure 7.
Model for the molecular architecture of the primosome. The model is based on the observations that the primase and polymerase activities reside in separate regions of the primosome, connected by a highly flexible linker (‘B’–B subunit; ‘S'–PriS; ‘L’–PriL; αCTD and αcat–C-terminal and catalytic domain of Pol α). The elongated shape of the primase can contact in principle the Pol lobe. Since the large subunit of the primase binds Pol α, PriL has been tentatively placed closer to Pol α (29,30). A schematic diagram of the steps of RNA–DNA primer synthesis, based on a hypothetical rearrangement of Pol and Prim lobes during primer transfer is also shown.

References

    1. Frick DN, Richardson CC. DNA primases. Annu. Rev. Biochem. 2001;70:39–80. - PubMed
    1. Kuchta RD, Stengel G. Mechanism and evolution of DNA primases. Biochim. Biophys. Acta. 2010;1804:1180–1189. - PMC - PubMed
    1. Hamdan SM, van Oijen AM. Timing, coordination, and rhythm: acrobatics at the DNA replication fork. J. Biol. Chem. 2010;285:18979–18983. - PMC - PubMed
    1. Burgers PM. Polymerase dynamics at the eukaryotic DNA replication fork. J. Biol. Chem. 2009;284:4041–4045. - PMC - PubMed
    1. Lao-Sirieix SH, Nookala RK, Roversi P, Bell SD, Pellegrini L. Structure of the heterodimeric core primase. Nat. Struct. Mol. Biol. 2005;12:1137–1144. - PubMed

Publication types

MeSH terms