

Epigenetic silencing of HIV-1 by the histone H3 lysine 27 methyltransferase enhancer of Zeste 2
- PMID: 21715480
- PMCID: PMC3165831
- DOI: 10.1128/JVI.00836-11
Epigenetic silencing of HIV-1 by the histone H3 lysine 27 methyltransferase enhancer of Zeste 2
Abstract
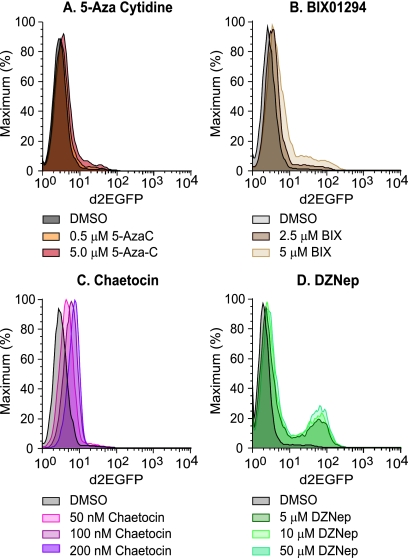
Latent HIV proviruses are silenced as the result of deacetylation and methylation of histones located at the viral long terminal repeat (LTR). Inhibition of histone deacetylases (HDACs) leads to the reemergence of HIV-1 from latency, but the contribution of histone lysine methyltransferases (HKMTs) to maintaining HIV latency remains uncertain. Chromatin immunoprecipitation experiments using latently infected Jurkat T-cell lines demonstrated that the HKMT enhancer of Zeste 2 (EZH2) was present at high levels at the LTR of silenced HIV proviruses and was rapidly displaced following proviral reactivation. Knockdown of EZH2, a key component of the Polycomb repressive complex 2 (PRC2) silencing machinery, and the enzyme which is required for trimethyl histone lysine 27 (H3K27me3) synthesis induced up to 40% of the latent HIV proviruses. In contrast, there was less than 5% induction of latent proviruses following knockdown of SUV39H1, which is required for H3K9me3 synthesis. Knockdown of EZH2 also sensitized latent proviruses to external stimuli, such as T-cell receptor stimulation, and slowed the reversion of reactivated proviruses to latency. Similarly, cell populations that responded poorly to external stimuli carried HIV proviruses that were enriched in H3K27me3 and relatively depleted in H3K9me3. Treating latently infected cells with the HKMT inhibitor 3-deazaneplanocin A, which targets EZH2, led to the reactivation of silenced proviruses, whereas chaetocin and BIX01294 showed only minimal reactivation activities. These findings suggest that PRC2-mediated silencing is an important feature of HIV latency and that inhibitors of histone methylation may play a useful role in induction strategies designed to eradicate latent HIV pools.
Figures


Similar articles
-
Multiple Histone Lysine Methyltransferases Are Required for the Establishment and Maintenance of HIV-1 Latency.mBio. 2017 Feb 28;8(1):e00133-17. doi: 10.1128/mBio.00133-17. mBio. 2017. PMID: 28246360 Free PMC article.
-
Epigenetic histone modification of Epstein-Barr virus BZLF1 promoter during latency and reactivation in Raji cells.J Virol. 2012 May;86(9):4752-61. doi: 10.1128/JVI.06768-11. Epub 2012 Feb 22. J Virol. 2012. PMID: 22357272 Free PMC article.
-
Down-regulation of the histone methyltransferase EZH2 contributes to the epigenetic programming of decidualizing human endometrial stromal cells.Mol Endocrinol. 2011 Nov;25(11):1892-903. doi: 10.1210/me.2011-1139. Epub 2011 Sep 8. Mol Endocrinol. 2011. PMID: 21903722 Free PMC article.
-
Roles of the EZH2 histone methyltransferase in cancer epigenetics.Mutat Res. 2008 Dec 1;647(1-2):21-9. doi: 10.1016/j.mrfmmm.2008.07.010. Epub 2008 Aug 3. Mutat Res. 2008. PMID: 18723033 Review.
-
EZH2 methyltransferase and H3K27 methylation in breast cancer.Int J Biol Sci. 2012;8(1):59-65. doi: 10.7150/ijbs.8.59. Epub 2011 Nov 18. Int J Biol Sci. 2012. PMID: 22211105 Free PMC article. Review.
Cited by
-
Bacterial Short Chain Fatty Acids Push All The Buttons Needed To Reactivate Latent Viruses.Stem Cell Epigenet. 2015;2(1):e532. doi: 10.14800/sce.532. Stem Cell Epigenet. 2015. PMID: 26029743 Free PMC article.
-
HIV-1 Vpr reactivates latent HIV-1 provirus by inducing depletion of class I HDACs on chromatin.Sci Rep. 2016 Aug 23;6:31924. doi: 10.1038/srep31924. Sci Rep. 2016. PMID: 27550312 Free PMC article.
-
The BAF complex and HIV latency.Transcription. 2012 Jul-Aug;3(4):171-6. doi: 10.4161/trns.20541. Epub 2012 Jul 1. Transcription. 2012. PMID: 22771990 Free PMC article. Review.
-
Therapeutic potential of inhibiting histone 3 lysine 27 demethylases: a review of the literature.Clin Epigenetics. 2022 Aug 1;14(1):98. doi: 10.1186/s13148-022-01305-8. Clin Epigenetics. 2022. PMID: 35915507 Free PMC article. Review.
-
CBX4 contributes to HIV-1 latency by forming phase-separated nuclear bodies and SUMOylating EZH2.EMBO Rep. 2022 Jul 5;23(7):e53855. doi: 10.15252/embr.202153855. Epub 2022 Jun 1. EMBO Rep. 2022. PMID: 35642598 Free PMC article.
References
-
- Bernstein B. E., et al. 2006. A bivalent chromatin structure marks key developmental genes in embryonic stem cells. Cell 125:315–326 - PubMed
Publication types
MeSH terms
Substances
Grants and funding
- R01 AI025899/AI/NIAID NIH HHS/United States
- T32 GM008056/GM/NIGMS NIH HHS/United States
- U19 AI082608/AI/NIAID NIH HHS/United States
- DP1-DA028869/DA/NIDA NIH HHS/United States
- R01 AI067093/AI/NIAID NIH HHS/United States
- T32-GM08056/GM/NIGMS NIH HHS/United States
- P30 AI036219/AI/NIAID NIH HHS/United States
- DP1 DA028869/DA/NIDA NIH HHS/United States
- R01 DA030156/DA/NIDA NIH HHS/United States
- P30-AI036219/AI/NIAID NIH HHS/United States
- R01-AI025899/AI/NIAID NIH HHS/United States
- R01-AI067093/AI/NIAID NIH HHS/United States
- U19-AI082608/AI/NIAID NIH HHS/United States
LinkOut - more resources
Full Text Sources
Other Literature Sources
