. 2011 Sep;85(17):8798-810.
doi: 10.1128/JVI.01831-10. Epub 2011 Jun 29.

Mammalian orthoreovirus escape from host translational shutoff correlates with stress granule disruption and is independent of eIF2alpha phosphorylation and PKR

Affiliations

Mammalian orthoreovirus escape from host translational shutoff correlates with stress granule disruption and is independent of eIF2alpha phosphorylation and PKR

Qingsong Qin et al. J Virol. 2011 Sep.

Abstract

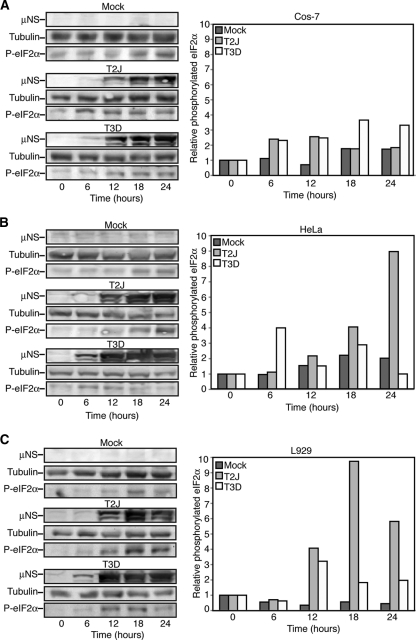
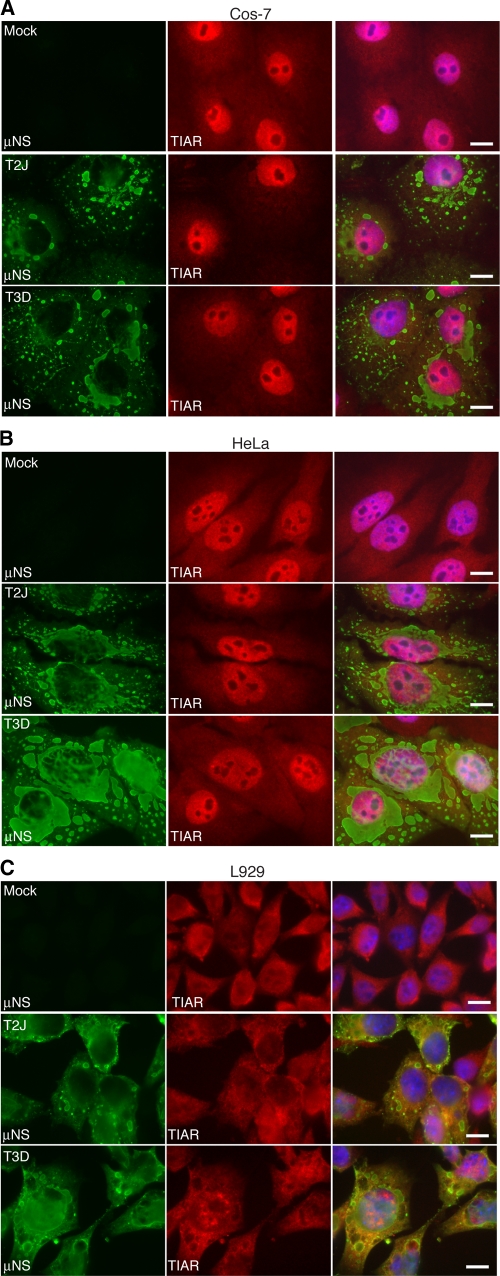
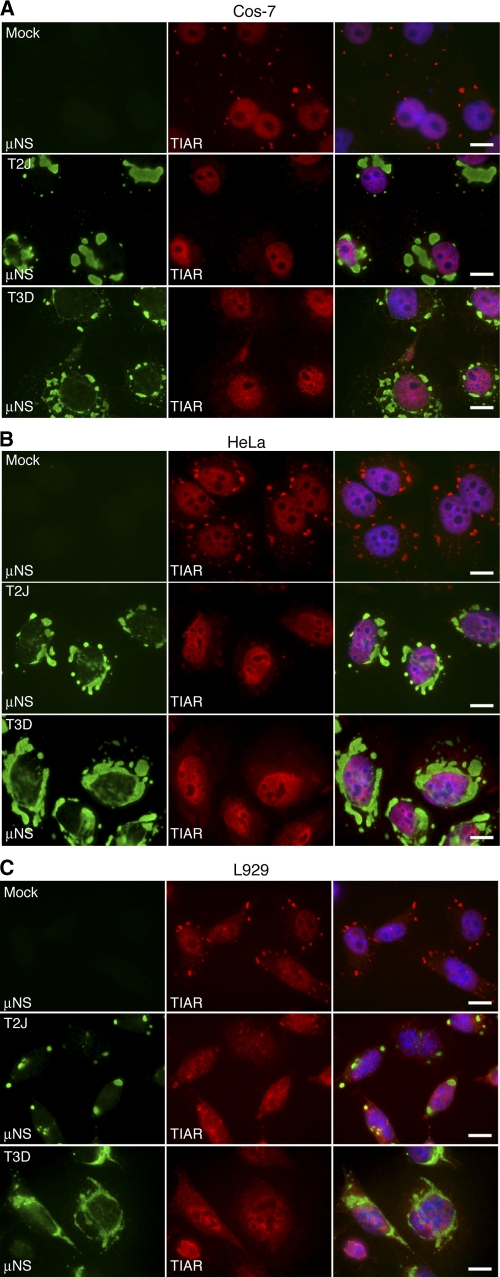
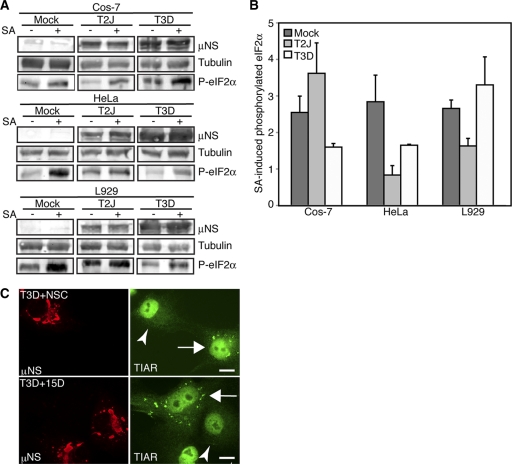
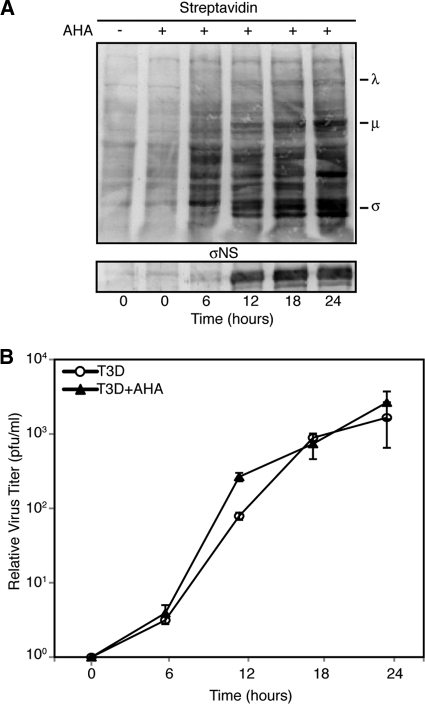
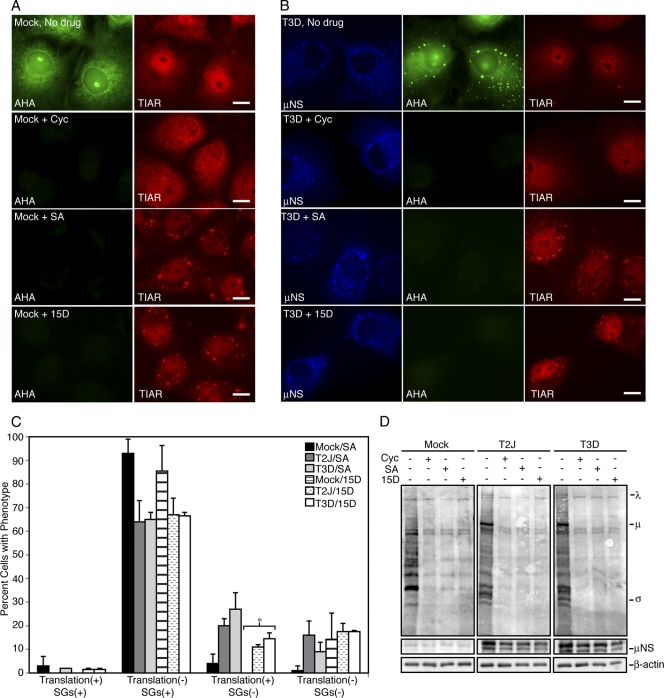
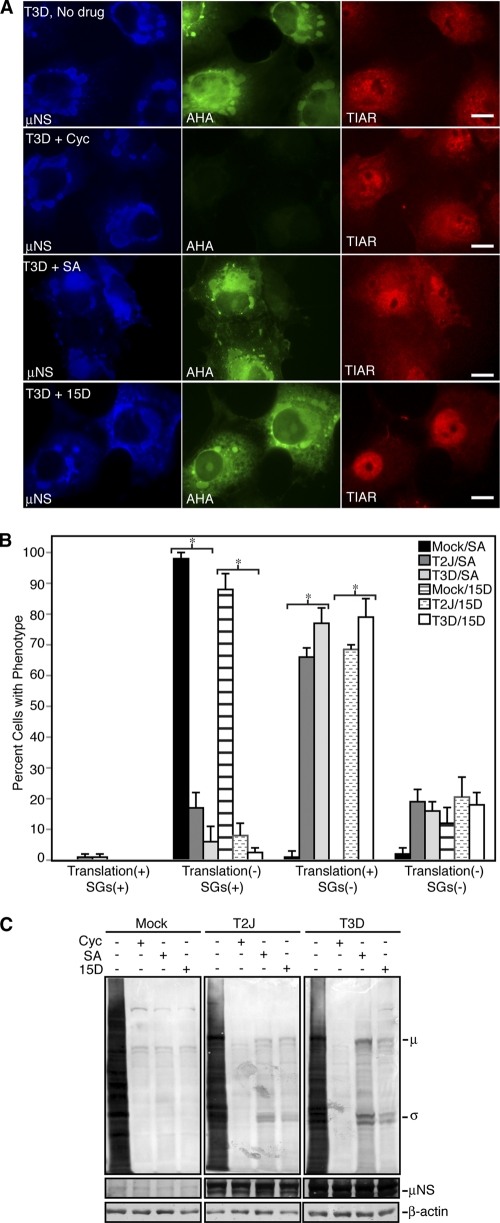
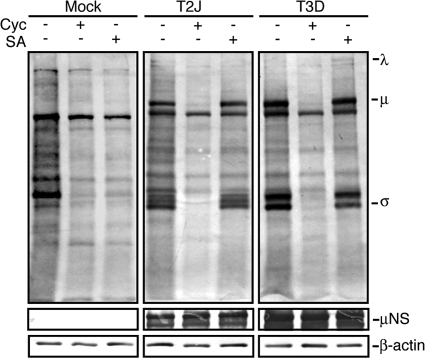
In response to mammalian orthoreovirus (MRV) infection, cells initiate a stress response that includes eIF2α phosphorylation and protein synthesis inhibition. We have previously shown that early in infection, MRV activation of eIF2α phosphorylation results in the formation of cellular stress granules (SGs). In this work, we show that as infection proceeds, MRV disrupts SGs despite sustained levels of phosphorylated eIF2α and, further, interferes with the induction of SGs by other stress inducers. MRV interference with SG formation occurs downstream of eIF2α phosphorylation, suggesting the virus uncouples the cellular stress signaling machinery from SG formation. We additionally examined mRNA translation in the presence of SGs induced by eIF2α phosphorylation-dependent and -independent mechanisms. We found that irrespective of eIF2α phosphorylation status, the presence of SGs in cells correlated with inhibition of viral and cellular translation. In contrast, MRV disruption of SGs correlated with the release of viral mRNAs from translational inhibition, even in the presence of phosphorylated eIF2α. Viral mRNAs were also translated in the presence of phosphorylated eIF2α in PKR(-/-) cells. These results suggest that MRV escape from host cell translational shutoff correlates with virus-induced SG disruption and occurs in the presence of phosphorylated eIF2α in a PKR-independent manner.


Figures

Fig. 1.
Fig. 1.
MRV infection induces eIF2α phosphorylation in a strain- and cell-type-specific manner. Cos-7 (A), HeLa (B), or L929 (C) cells were mock infected or infected with MRV T2J or T3D. At 0, 6, 12, 18, and 24 h p.i., cells were harvested and proteins were separated on SDS-PAGE and transferred to nitrocellulose. The membranes were blotted with rabbit α-μNS polyclonal antibody, rabbit α-tubulin polyclonal antibody, and rabbit α-phosphorylated (P)-eIF2α polyclonal antibody, followed by goat α-rabbit IgG conjugated with AP. Bound AP conjugates were detected by chemiluminescence staining and quantified with Quantity-One software. Quantified amounts of phosphorylated eIF2α were divided by quantified amounts of α-tubulin to adjust for differences in gel loading, and then increases in eIF2α phosphorylation relative to time zero were calculated and are shown on the right.
Fig. 2.
Fig. 2.
MRV-infected cells do not contain SGs at late times p.i. Cos-7 (A), HeLa (B), and L929 (C) cells were mock infected (top row) or infected with MRV T2J (middle row) or T3D (bottom row). At 24 h p.i., the cells were fixed and immunostained with rabbit α-μNS poly- clonal antiserum (left column) and goat α-TIAR polyclonal antibody (middle column), followed by Alexa 594-conjugated donkey α-rabbit IgG and Alexa 488-conjugated donkey α-goat IgG. Merged images containing DAPI-stained nuclei (blue) are shown (right columns). Bars = 10 μm.
Fig. 3.
Fig. 3.
MRV infection renders cells unable to form SGs in response to SA. Cos-7 (A), HeLa (B), or L929 (C) cells were mock infected (top rows) or infected with MRV T2J (middle rows) or T3D (bottom rows). At 24 h p.i., the cells were treated with SA for 1 h and then fixed and immunostained with rabbit α-μNS polyclonal antiserum (left columns) and goat α-TIAR polyclonal antibody (middle columns), followed by Alexa 594-conjugated donkey α-rabbit IgG and Alexa 488-conjugated donkey α-goat IgG. Merged images containing DAPI-stained nuclei (blue) are shown (right columns). Bars = 10 μm.
Fig. 4.
Fig. 4.
MRV interferes with SGs downstream of eIF2α phosphorylation. (A) Cos-7, HeLa, or L929 cells were mock infected or infected with MRV T2J or T3D. At 24 h.p.i., the cells were left untreated or treated with SA for 1 h. Samples were harvested, and proteins were separated on SDS-PAGE and electroblotted to nitrocellulose. The nitrocellulose membranes were immunoblotted with rabbit α-μNS polyclonal antiserum, rabbit α-tubulin polyclonal antibodies, and rabbit α-phosphorylated (P) eIF2α polyclonal antibodies, as indicated, followed by goat α-rabbit IgG conjugated with AP, and bound AP conjugates were detected by chemiluminescence. (B) AP conjugates from panel A were quantified with Quantity-One software. Quantified amounts of phosphorylated eIF2α were divided by quantified amounts of α-tubulin to adjust for differences in gel loading. Fold increases in levels of phosphorylated eIF2α in SA-treated cells relative to untreated cells were calculated, and the means and standard deviations of two experimental replicates are shown. (C) Cos-7 cells were infected with MRV T3D, and at 24 h p.i., the cells were treated with either NSC119893 (top row) or 15D-PGJ2 (bottom row) for 1 h and then fixed and immunostained with rabbit α-μNS polyclonal antiserum (left column) and goat α-TIAR polyclonal antibody (right column), followed by Alexa 594-conjugated donkey α-rabbit IgG and Alexa 488-conjugated donkey α-goat IgG. The arrowheads identify infected cells that do not contain SGs. The arrows identify uninfected cells that do contain SGs. Bars = 10 μm.
Fig. 5.
Fig. 5.
l-AHA labeling does not interfere with MRV replication. L929 cells were infected with T3D with and without the addition of l-AHA, and at 0, 6, 12, 18, and 24 h, cells were harvested and processed. (A) Following lysis, samples were separated on SDS-PAGE, transferred to nitrocellulose, and then probed with streptavidin-conjugated AP or σNS polyclonal antibodies, followed by AP-conjugated α-rabbit IgG. Bound AP conjugates were detected by chemiluminescence. The positions of MRV proteins in the blot are indicated. (B) Lysed samples were subjected to standard MRV plaque assay on L929 cells. The plaques were counted, and the relative increases in virus titer from time zero were calculated. The means and standard deviations of two experimental replicates are shown.
Fig. 6.
Fig. 6.
Viral and cellular translation are inhibited when SGs are present. (A and B) Cos-7 cells were mock infected (A) or infected with T3D (B), and at 6 h p.i., the cells were left untreated (No drug; top row) or treated with cycloheximide (Cyc; second row), SA (third row), or 15D-PGJ2 (15D; bottom row) for 45 min and then labeled with l-AHA for 30 min in the presence of drugs. The cells were fixed and permeabilized, labeled with biotin, and then stained with Alexa 488-conjugated streptavidin (AHA) (left column in panel A; middle column in panel B), rabbit α-μNS polyclonal antiserum (μNS) (left column in panel B), and goat α-TIAR polyclonal antibodies (TIAR) (right columns), followed by Alexa 350-conjugated donkey α-rabbit IgG or Alexa 594-conjugated donkey α-goat IgG. Bars = 10 μm. (C) Following treatment as in panel A, cells were counted based on their translation and SG phenotype. The percentage of cells containing each phenotype out of the total number of cells counted was calculated, and the means and standard deviations of two experimental replicates are shown. Infected groups that were statistically different from mock-infected cells are indicated by an asterisk (P < 0.005). (D) Cos-7 cells were mock infected or infected with T2J or T3D and were treated with drugs as in panel A for 60 min, at which point l-AHA was added in the presence of drugs for an additional 60 min. Proteins were labeled with biotin and then separated on SDS-PAGE and transferred to nitrocellulose by electroblotting. l-AHA-labeled proteins were detected by incubation of blots with AP-conjugated streptavidin. As protein loading and infection controls, identical sample volumes were examined in parallel using rabbit anti-β-actin polyclonal antibodies or rabbit α-μNS polyclonal antibodies followed by AP-conjugated goat α-rabbit IgG. The positions of MRV proteins on the AHA blot are indicated.
Fig. 7.
Fig. 7.
MRV mRNAs escape translational shutoff when SGs are disrupted. (A) Cos-7 cells were infected with T3D, and at 24 h p.i., the cells were left untreated (No drug; top row) or treated with cycloheximide (Cyc; second row), SA (third row), or 15D-PGJ2 (15D; bottom row) for 45 min and then labeled with l-AHA for 30 min in the presence of drugs. The cells were fixed, permeabilized, labeled with biotin, and then stained with Alexa 488-conjugated streptavidin (AHA; middle column), rabbit α-μNS polyclonal antiserum (μNS; left column), and goat anti-TIAR polyclonal antibodies (TIAR; right column), followed by Alexa 350-conjugated donkey α-rabbit IgG or Alexa 594-conjugated donkey α-goat IgG. Bars = 10 μm. (B) Following treatment as in panel A, cells were counted based on their translation and SG phenotype. The percentage of cells containing each phenotype out of the total number of cells counted was calculated, and the means and standard deviations of three experimental replicates are shown. Infected groups that were statistically different from mock-infected cells are indicated by an asterisk (P < 0.005). (C) Cos-7 cells were mock infected or infected with T2J or T3D and were treated with drugs as in panel A for 60 min, at which point l-AHA was added in the presence of drugs for an additional 60 min. Proteins were labeled with biotin and then separated on SDS-PAGE and transferred to nitrocellulose by electroblotting. l-AHA-labeled proteins were detected by incubation of blots with AP-conjugated streptavidin. As protein-loading and infection controls, identical sample volumes were examined in parallel using rabbit anti-β-actin polyclonal antibodies or rabbit α-μNS polyclonal antibodies followed by AP-conjugated goat α-rabbit IgG. The positions of MRV proteins on the AHA blot are indicated.
Fig. 8.
Fig. 8.
SA does not inhibit MRV translation in PKR−/− cells. PKR−/− cells were mock infected or infected with T2J or T3D, and at 24 h p.i., the cells were left untreated or treated with cycloheximide (Cyc) or SA for 60 min, at which point l-AHA was added and the cells were incubated an additional 60 min. Proteins were labeled with biotin, separated on SDS-PAGE, and transferred to nitrocellulose by electroblotting. l-AHA-labeled proteins were detected by incubation of blots with AP-conjugated streptavidin. As protein-loading and infection controls, identical sample volumes were examined in parallel using rabbit α-β-actin polyclonal antibodies or rabbit α-μNS polyclonal antibodies followed by AP-conjugated goat α-rabbit IgG. The positions of MRV proteins on the AHA blot are indicated.

Similar articles

Cited by

References

    1. Beattie E., et al. 1995. Reversal of the interferon-sensitive phenotype of a vaccinia virus lacking E3L by expression of the reovirus S4 gene. J. Virol. 69:499–505 - PMC - PubMed
    1. Brendler T., Godefroy-Colburn T., Yu S., Thach R. E. 1981. The role of mRNA competition in regulating translation. III. Comparison of in vitro and in vivo results. J. Biol. Chem. 256:11755–11761 - PubMed
    1. Dang Y., et al. 2006. Eukaryotic initiation factor 2α-independent pathway of stress granule induction by the natural product pateamine A. J. Biol. Chem. 281:32870–32878 - PubMed
    1. Detjen B. M., Walden W. E., Thach R. E. 1982. Translational specificity in reovirus-infected mouse fibroblasts. J. Biol. Chem. 257:9855–9860 - PubMed
    1. Dieterich D. C., Link A. J., Graumann J., Tirrell D. A., Schuman E. M. 2006. Selective identification of newly synthesized proteins in mammalian cells using bioorthogonal noncanonical amino acid tagging (BONCAT). Proc. Natl. Acad. Sci. U. S. A. 103:9482–9487 - PMC - PubMed

Publication types

LinkOut - more resources