. 2011 Aug;21(8):1375-87.
doi: 10.1101/gr.117176.110. Epub 2011 Jun 29.

Putting genetic interactions in context through a global modular decomposition

Affiliations

Putting genetic interactions in context through a global modular decomposition

Jeremy Bellay et al. Genome Res. 2011 Aug.

Abstract

Genetic interactions provide a powerful perspective into gene function, but our knowledge of the specific mechanisms that give rise to these interactions is still relatively limited. The availability of a global genetic interaction map in Saccharomyces cerevisiae, covering ∼30% of all possible double mutant combinations, provides an unprecedented opportunity for an unbiased assessment of the native structure within genetic interaction networks and how it relates to gene function and modular organization. Toward this end, we developed a data mining approach to exhaustively discover all block structures within this network, which allowed for its complete modular decomposition. The resulting modular structures revealed the importance of the context of individual genetic interactions in their interpretation and revealed distinct trends among genetic interaction hubs as well as insights into the evolution of duplicate genes. Block membership also revealed a surprising degree of multifunctionality across the yeast genome and enabled a novel association of VIP1 and IPK1 with DNA replication and repair, which is supported by experimental evidence. Our modular decomposition also provided a basis for testing the between-pathway model of negative genetic interactions and within-pathway model of positive genetic interactions. While we find that most modular structures involving negative genetic interactions fit the between-pathway model, we found that current models for positive genetic interactions fail to explain 80% of the modular structures detected. We also find differences between the modular structures of essential and nonessential genes.


Figures
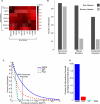
Figure 1.
Figure 1.
(A) A bicluster from the SGA genetic interaction network—an enrichment for (negative) genetic interactions between a set of query genes and a set of array genes. This bicluster was found by combining XMOD biclusters using MCL (see Methods). (B) A comparison of biclusters found on the real SGA network and the average number of biclusters found on randomized networks. While a significant number of biclusters are found on the random networks (Discovered Biclusters), statistical filtering leaves, on average, 20 random biclusters versus ∼200,000 real biclusters (Filtered Biclusters). After controlling for redundancy, there were ∼10,000 real biclusters (Condensed Biclusters) but again only ∼20 random biclusters on average. (C) A plot of the proportion of biclusters that meet or exceed a given functional relatedness score. XMOD condensed blocks is solid blue, LCD (Pu et al. 2008) is dashed red, CC (Cheng and Church 2000) is dashed cyan, and PISA (Ihmels et al. 2002; Kloster et al. 2005) is dashed black. We also compare the methods after removing overlapping clusters from all methods in Supplemental Figure S7. (D) The percentage of interactions covered by biclusters whose functional relatedness score was in the top 90th percentile of the MEFIT network [the line is marked in (C)].
Figure 2.
Figure 2.
(A) The coverage of genetic interactions by XMOD biclusters. The interactions are divided into “covered” interactions that occur within a bicluster and “isolated” interactions that occur outside of a bicluster. Fifty-eight percent of negative interactions are covered compared to only 19% of positive interactions. (B) A plot of the proportion of negatively interacting duplicate pairs [either “isolated” (orange) or “covered” (red)] against the amino acid sequence identity of the duplicate pair.
Figure 3.
Figure 3.
(A) A histogram of profile structure among hubs. (B) The Spearman correlation coefficients of profile structure and negative GI degree against gene properties that are better correlated with profile structure than degree. Error bars represent 95% confidence intervals and were derived through bootstrapping. (C) The Spearman correlation coefficients of profile structure and negative GI degree against gene properties better correlated with negative GI degree than profile structure. Error bars represent 95% confidence intervals and were derived through bootstrapping.
Figure 4.
Figure 4.
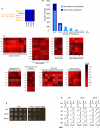
(A) Functional enrichment for each gene is derived from significant functional enrichments of other genes that appear in the same biclusters (see Methods for details). (B) A histogram of the number of processes associated with each gene as determined by the distinct functional enrichments of the biclusters of which that gene is a member (light blue) and the number of GO annotations currently given to that gene (dark blue). (C) Some example biclusters that contain the gene VIP1. VIP1 only has one GO annotation, but appears in a variety of highly enriched functional contexts. (D) vip1Δ and ipk1Δ exhibit reduced viability in the presence of MMS. Serial 10-fold dilutions of vip1Δ and ipk1Δ were spotted onto YPD or YPD + 0.040% MMS and incubated at 30°C for 3 d. (E) vip1Δ and ipk1Δ exhibit DNA replication defects in the presence of MMS. Cells were arrested in G1 and released synchronously into the cell cycle in either the presence or absence of 0.035% MMS. Histograms represent the cell cycle distribution after release from G1 arrest ± MMS for the specified times. Positions of cells with 1C and 2C DNA contents are indicated.
Figure 5.
Figure 5.
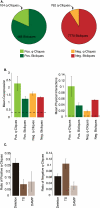
(A) The proportion of q-cliques and bicliques for positive and negative interactions. Nine percent of negative biclusters are q-cliques, while 18% of positive biclusters are q-cliques. (B) The left bar plot shows the mean of the mean coexpression of array genes within positive q-cliques, positive bicliques, negative q-cliques, and negative bicliques. The dashed line is the mean MEFIT score between all gene pairs. The right plot shows the mean of the mean number of physical interactions among the array genes of the positive q-cliques, positive bicliques, negative q-cliques, and negative bicliques. The dashed line is the background rate of PPIs between gene pairs. (C) The ratio of q-cliques to q-cliques + bicliques for different types of query alleles. Deletion mutants appear in a high proportion of positive q-cliques, while TS mutants appear in more negative q-cliques. All error bars are bootstrapped 95% confidence intervals.

References

    1. Agrawal R, Imielinski T, Swami A 1993. Mining association rules between sets of items in large databases. Proc ACM SIGMOD Int Conf Manag Data 22: 207–216
    1. Altschul S, Gish W, Miller W, Myers E, Lipman D 1990. Basic local alignment search tool. J Mol Biol 215: 403–410 - PubMed
    1. Bandyopadhyay S, Kelley R, Krogan NJ, Ideker T 2008. Functional maps of protein complexes from quantitative genetic interaction data. PLoS Comput Biol 4: e1000065 doi: 10.1371/journal.pcbi.1000065 - PMC - PubMed
    1. Baryshnikova A, Costanzo M, Kim Y, Ding H, Koh J, Toufighi K, Youn J, Ou J, San Luis B, Bandyopadhyay S, et al. 2010. Quantitative analysis of fitness and genetic interactions in yeast on a genome scale. Nat Methods 7: 1017–1024 - PMC - PubMed
    1. Batada NN, Reguly T, Breitkreutz A, Boucher L, Breitkreutz B, Hurst LD, Tyers M 2006. Stratus not altocumulus: A new view of the yeast protein interaction network. PLoS Biol 4: e317 doi: 10.1371/journal.pbio.0040317 - PMC - PubMed

Publication types

MeSH terms

Substances