

Functional development of large-scale sensorimotor cortical networks in the brain
- PMID: 21715622
- PMCID: PMC6623158
- DOI: 10.1523/JNEUROSCI.5995-10.2011
Functional development of large-scale sensorimotor cortical networks in the brain
Abstract
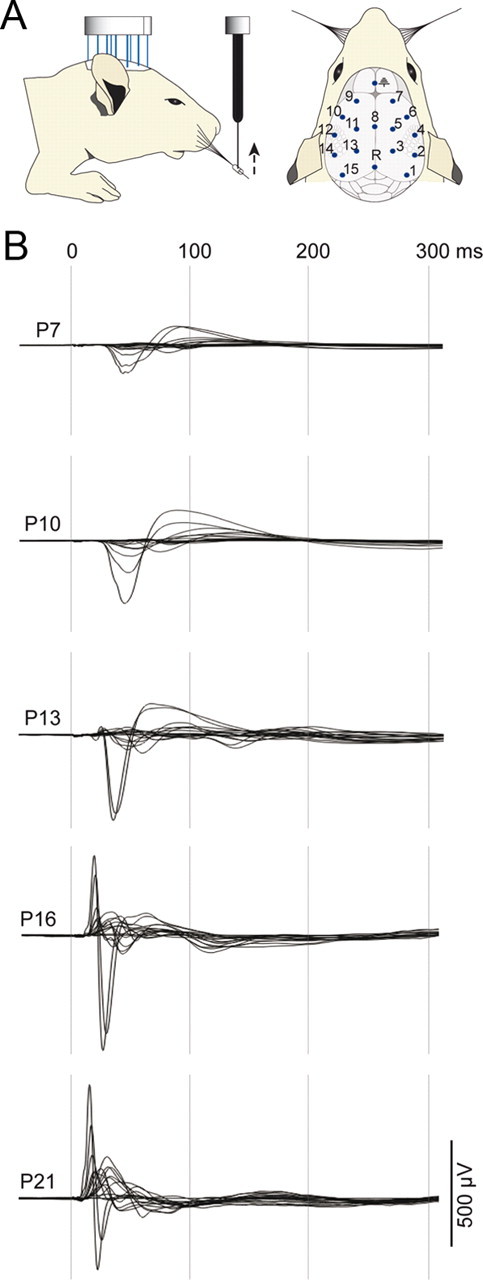
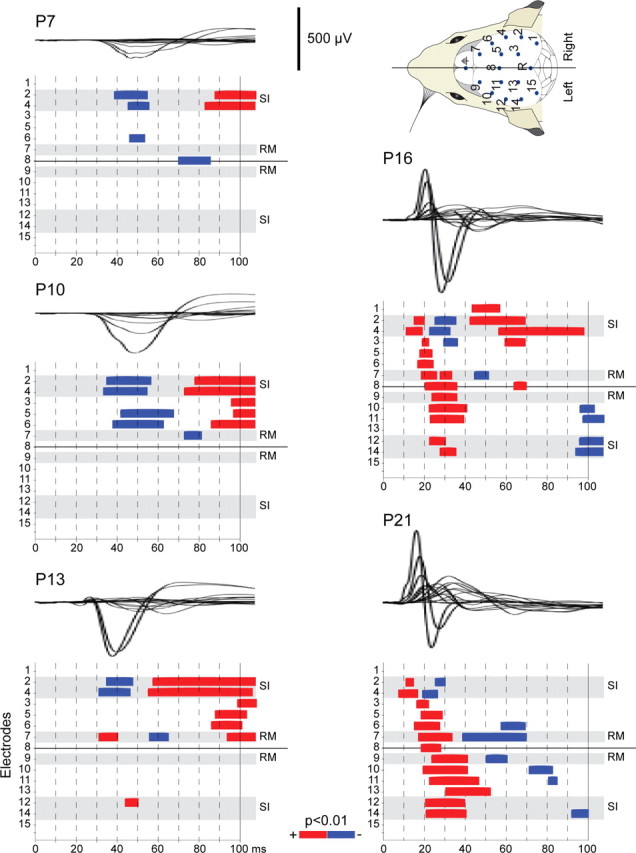
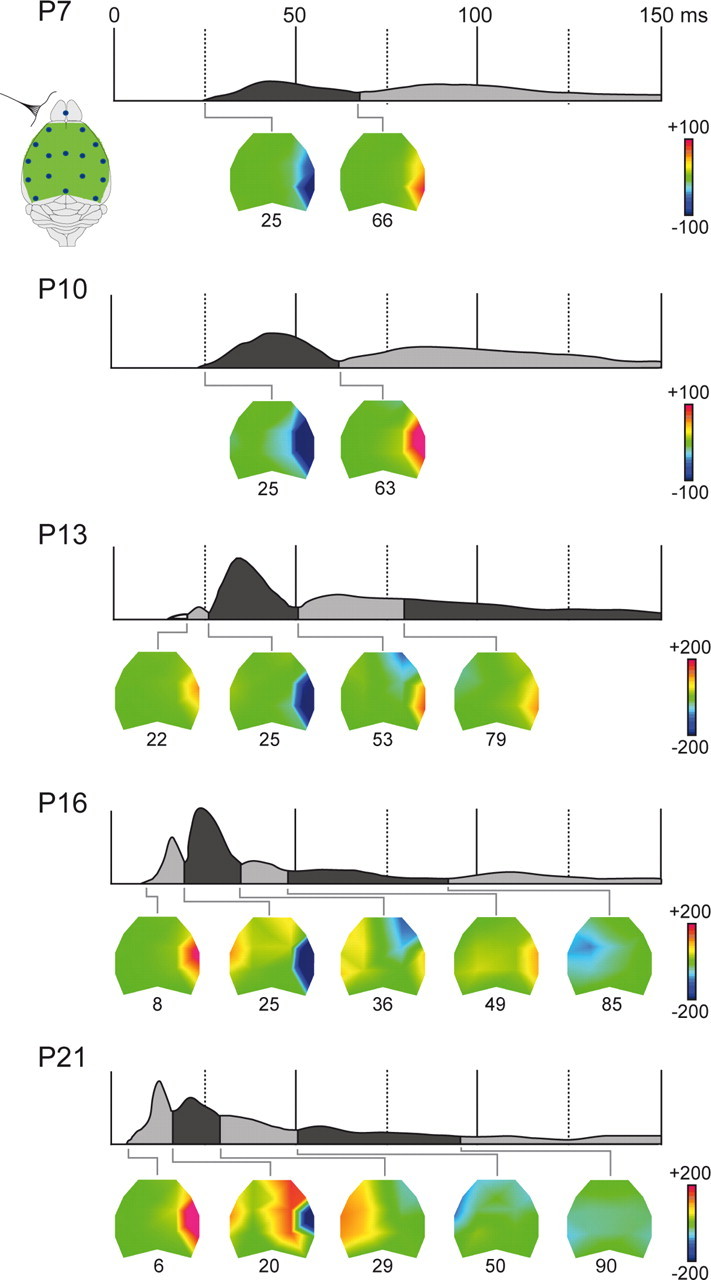
Large-scale neuronal networks integrating several cortical areas mediate the complex functions of the brain such as sensorimotor integration. Little is known about the functional development of these networks and the maturational processes by which distant networks become functionally connected. We addressed this question in the postnatal rat sensorimotor system. Using epicranial multielectrode grids that span most of the cortical surface and intracortical electrodes, we show that sensory evoked cortical responses continuously maturate throughout the first 3 weeks with the strongest developmental changes occurring in a very short time around postnatal day 13 (P13). Before P13, whisker stimulation evokes slow, initially surface-negative activity restricted mostly to the lateral parietal area of the contralateral hemisphere. In a narrow time window of ∼48 h around P13, a new early, sharp surface-positive component emerges that coincides with subsequent propagation of activity to sensory and motor areas of both hemispheres. Our data show that this new component developing at the end of the second week corresponds principally to functional maturation of the supragranular cortical layers and appears to be crucial for the functional associations in the large-scale sensorimotor cortical network. It goes along with the onset of whisking behavior, as well as major synaptic and functional changes within the S1 cortex that are known to develop during this period.
Figures
Similar articles
-
Large-scale organization of rat sensorimotor cortex based on a motif of large activation spreads.J Neurosci. 2008 Dec 3;28(49):13274-84. doi: 10.1523/JNEUROSCI.4074-08.2008. J Neurosci. 2008. PMID: 19052219 Free PMC article.
-
Functional deficit and recovery of developing sensorimotor networks following neonatal hypoxic-ischemic injury in the rat.Cereb Cortex. 2010 Sep;20(9):2080-91. doi: 10.1093/cercor/bhp281. Epub 2010 Jan 4. Cereb Cortex. 2010. PMID: 20051355
-
A mouse model for studying large-scale neuronal networks using EEG mapping techniques.Neuroimage. 2008 Aug 15;42(2):591-602. doi: 10.1016/j.neuroimage.2008.05.016. Epub 2008 May 21. Neuroimage. 2008. PMID: 18585931
-
Integrated technology for evaluation of brain function and neural plasticity.Phys Med Rehabil Clin N Am. 2004 Feb;15(1):263-306. doi: 10.1016/s1047-9651(03)00124-4. Phys Med Rehabil Clin N Am. 2004. PMID: 15029909 Review.
-
Neocortical dynamics during whisker-based sensory discrimination in head-restrained mice.Neuroscience. 2018 Jan 1;368:57-69. doi: 10.1016/j.neuroscience.2017.09.003. Epub 2017 Sep 14. Neuroscience. 2018. PMID: 28919043 Free PMC article. Review.
Cited by
-
Assessing the performance of Granger-Geweke causality: Benchmark dataset and simulation framework.Data Brief. 2018 Oct 16;21:833-851. doi: 10.1016/j.dib.2018.10.034. eCollection 2018 Dec. Data Brief. 2018. PMID: 30417043 Free PMC article.
-
Neurovascular coupling and decoupling in the cortex during voluntary locomotion.J Neurosci. 2014 Aug 13;34(33):10975-81. doi: 10.1523/JNEUROSCI.1369-14.2014. J Neurosci. 2014. PMID: 25122897 Free PMC article.
-
Alteration in Functional Magnetic Resonance Imaging Signal Complexity Across Multiple Time Scales in Patients With Migraine Without Aura.Front Neurosci. 2022 Mar 7;16:825172. doi: 10.3389/fnins.2022.825172. eCollection 2022. Front Neurosci. 2022. PMID: 35345545 Free PMC article.
-
Structure supports function: Informing directed and dynamic functional connectivity with anatomical priors.Netw Neurosci. 2022 Jun 1;6(2):401-419. doi: 10.1162/netn_a_00218. eCollection 2022 Jun. Netw Neurosci. 2022. PMID: 35733424 Free PMC article.
-
Mapping epileptic activity: sources or networks for the clinicians?Front Neurol. 2014 Nov 5;5:218. doi: 10.3389/fneur.2014.00218. eCollection 2014. Front Neurol. 2014. PMID: 25414692 Free PMC article. Review.
References
-
- Ahissar E, Kleinfeld D. Closed-loop neuronal computations: focus on vibrissa somatosensation in rat. Cereb Cortex. 2003;13:53–62. - PubMed
-
- Ahissar E, Sosnik R, Haidarliu S. Transformation from temporal to rate coding in a somatosensory thalamocortical pathway. Nature. 2000;406:302–306. - PubMed
-
- Alloway KD, Zhang M, Chakrabarti S. Septal columns in rodent barrel cortex: functional circuits for modulating whisking behavior. J Comp Neurol. 2004;480:299–309. - PubMed
Publication types
MeSH terms
LinkOut - more resources
Full Text Sources