. 2011 Jun 29;31(26):9708-22.
doi: 10.1523/JNEUROSCI.5814-10.2011.

Stimulus-specific adaptation in the gerbil primary auditory thalamus is the result of a fast frequency-specific habituation and is regulated by the corticofugal system

Affiliations

Stimulus-specific adaptation in the gerbil primary auditory thalamus is the result of a fast frequency-specific habituation and is regulated by the corticofugal system

Peter Bäuerle et al. J Neurosci. .

Abstract

The detection of novel and therefore potentially behavioral relevant stimuli is of fundamental importance for animals. In the auditory system, stimulus-specific adaptation (SSA) resulting in stronger responses to rare compared with frequent stimuli was proposed as such a novelty detection mechanism. SSA is a now well established phenomenon found at different levels along the mammalian auditory pathway. It depends on various stimulus features, such as deviant probability, and may be an essential mechanism underlying perception of changes in sound statistics. We recorded neuronal responses from the ventral part of the medial geniculate body (vMGB) in Mongolian gerbils to determine details of the adaptation process that might indicate underlying neuronal mechanisms. Neurons in the vMGB exhibited a median spike rate change of 15.4% attributable to a fast habituation to the frequently presented standard stimulus. Accordingly, the main habituation effect could also be induced by the repetition of a few uniform tonal stimuli. The degree of habituation was frequency-specific, and comparison across simultaneously recorded units indicated that adaptation effects were apparently topographically organized. At the population level, stronger habituation effects were on average associated with the border regions of the frequency response areas. Finally, the pharmacological inactivation of the auditory cortex demonstrated that SSA in the vMGB is mainly regulated by the corticofugal system. Hence, these results indicate a more general function of SSA in the processing and analysis of auditory information than the term novelty detection suggests.


Figures

Figure 1.
Figure 1.
Frequency-dependent adaptation in the spike rate of a well isolated vMGB unit. A, The frozen trial sequence of 100 stimuli with fixed (pseudorandomized) deviant positions is illustrated in the bottom two lines (ts1, ts2). A frozen trial sequence consisted of 10% deviant and 90% standard stimuli with the two tones f1 (here 1 KHz, black bars) and f2 (here 2 KHz, gray bars) being the deviant in one and the standard in the other trial sequence. As indicated by small arrows, deviant-related responses of one frozen trial sequence (e.g., from ts1) were compared with each standard-related response in the preceding position of the corresponding sequence. A frozen trial sequence (e.g., ts1 or ts2) was repeated 10 times comprising a block of 1000 trials. The responses of a single unit to two corresponding blocks B1 and B2 are shown in the middle and top parts of A. The dot plots indicate the timing of single spikes in the 60 ms after stimulus onset for all 1000 trials (left column) and a subset of 35 trials at a higher temporal resolution (right column). Responses to tones of frequency f1 are indicated in black dots and responses to frequency f2 in gray dots. Higher spike counts per trial can be observed for the frequency f1 (black arrows, black numbers to the right) compared with the frequency f2 (gray arrows, gray numbers to the right), regardless of f1 being either the deviant in block B1 or the standard in block B2. However, focusing on the single frequency f1, higher spike counts per trial can be noticed for f1 as deviant (bottom row) than for f1 as standard tone (top row). The same is true for f2 being the deviant in the top row and the standard frequency in the bottom row. Spike waveforms of a 10% sample of all recorded responses to standard and deviant stimuli of both frequencies within this experiment are shown at the top right (4671 single waveforms). B, Distribution of spike counts in responses to both frequencies f1 and f2 being either the standard (bottom, f2; top, f1) or the deviant frequency (bottom, f1; top, f2). Spike counts per trial are shown at a single-trial resolution (4 plots in the middle) or as the average distribution of spike counts (top and bottom). There is a noticeable shift from higher to lower spike counts in responses to both frequencies in the deviant with respect to the corresponding standard position.
Figure 2.
Figure 2.
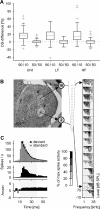
Population analysis of unit activity recorded from the gerbil vMGB in the oddball paradigm (n = 100). A, Differences in spike sum between responses to deviant and standard tones (DS difference) are shown. Beside the data for the whole population with units averaged across configurations B1 and B2 (“Unit,” left 2 box plots), data were also calculated separately for the relative LF (middle 2 box plots) and the relative HF (right 2 box plots) of each stimulation pair. For each separate population, data are given for the deviant probability of the test condition (90/10) as well as the control condition (50/50). B, Coronal histological section through the gerbil MGB stained with cresyl violet. Scale bar, 200 μm. v, Ventral part of the MGB; d, dorsal part of the MGB. Asterisks mark electrolytic lesions through recording channels 2 and 16. A schematic drawing of the recording electrode together with the simultaneously recorded receptive field areas of all 16 channels calculated with the raw spike data (experimental control) is shown on the right side. The normalized level of activity per channel coded in grayscale is displayed to the left. This multichannel recording illustrates the tonotopic organization of the vMGB as well as the border to the dorsal division. In this example, the border was determined between channels 13 and 14, indicated by a loosening of the tonotopic axes together with a widening of the neuronal receptive field areas on the dorsal side. C, Average onset response of vMGB units from the deviant compared with the standard configuration shown as population PSTH (top; average activity of 200 frequencies, bin size of 2 ms), as averaged difference in spike activity (middle; deviant − standard), and as arc-sinus-corrected difference (bottom). Deviant-related activity is shown in black and standard-related activity in gray. The time range with a light gray background illustrates the typical investigated 30 ms time window exemplified here for the population PSTH.
Figure 3.
Figure 3.
Comparison of probability-dependent activity levels between various stimulation paradigms (n = 73). Shown are average responses (population median ± interquartile range of the averaged number of spikes per trial) to stimuli of different probability, derived from different stimulation paradigms applied. Comparison was done only for frequencies at 60 dB SPL that were tested in all of the following stimulus configurations: the FRA, the FRC, and four different stimulus types taken from the oddball paradigm. These included the deviant (D), the standard tone right before the deviant (Sb), the standard tone right after the deviant (Sa), and the tonal response in the control condition with equal probability for standard and deviant (50%). Dotted line denotes the median of Sb. Statistical comparisons are indicated above the bars, with the asterisks representing the level of significance (***p < 0.001). Tests based on the two-sample Kolmogorov–Smirnov test are drawn in black, and those based on the Wilcoxon's signed rank test are colored in gray.
Figure 4.
Figure 4.
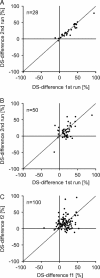
Frequency-specific effects of SSA in vMGB units. A, Comparison of DS-difference values (from 1st vs 2nd stimulus set) taken from oddball paradigms repeated twice per unit. The complete stimulus set (10 blocks plus control conditions) was repeated immediately after the first presentation with the same frequency pair in 14 units (28 frequencies tested twice) to determine the stability of adaptation over time during the same recording experiment. Data points cluster along the diagonal (bottom left to the top right corner), indicating equal values for the repeated stimulus set. B, Comparison of DS-difference values (from 1st vs 2nd stimulus set) taken from blocks of the oddball paradigm repeated with a slightly different frequency pair (0.4 octaves on average) in the same unit. Data from 25 units (50 frequencies for each stimulus set) are included. Data points scatter around the diagonal, indicating that adaptation is not independent of stimulation frequency. C, Comparison of DS-difference values taken from the relative lower (f1) versus the relative higher (f2) frequency of each frequency pair tested in the oddball paradigm (100 units). Population data were already shown in Figure 2A. Once again, the data do not cluster along the diagonal.
Figure 5.
Figure 5.
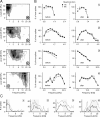
Example of frequency-specific differences in adaptation in a vMGB unit tested consecutively with stimulus sets of the oddball protocol using three different frequency pairs. A, Frequency response area. The tuning curve is marked by the dashed black line. White points at 60 dB SPL indicate the tested frequencies, and the white numbers identify the three different frequency pairs in their chronological order of presentation. The number in the gray circle (bottom left corner) represents the recording channel. The response activity of the unit is coded in grayscale as indicated on the right side. Areas in the plot enclosed in solid black lines exhibit an activity level exceeding the mean plus 1 SD of the interstimulus activity level. B, Average normalized standard-related (gray line) and deviant-related (black line) activity for the six different test frequencies (top row) and the difference in activity (deviant − standard; bottom row) depicted in PSTHs (2 ms bin width). The pure tone frequency is indicated above each column. The number of the stimulation pair for this frequency is given in the top right corner of each difference PSTH in the bottom row, with the percentage DS-difference value stated beneath. Although the three frequency pairs were recorded in three consecutive stimulus sets, the four left panels for frequencies in the central part of the tuning curve exhibit comparable DS-difference values from 13 to 23%, whereas the two right ones from more peripherally located frequencies show larger effects.
Figure 6.
Figure 6.
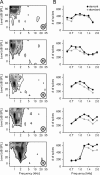
Example of frequency-specific differences in adaptation in three vMGB units recorded simultaneously from three different recording channels. The units were tested consecutively with stimulus sets of the oddball protocol using two different frequency pairs. A, Frequency response areas of the three units. The tuning curve in each plot is marked by the dashed black line. White points at 60 dB SPL indicate the tested frequencies, and the white numbers identify the two different frequency pairs in their chronological order. The number in the gray circle (bottom left corner) represents the recording channel. Areas enclosed in solid black lines exhibit an activity level exceeding the mean plus 1 SD of the interstimulus activity level. Activity encoded in grayscale as indicated in Figure 5. B, Plots to the right of each frequency response area present data for each respective unit. Shown are the average normalized standard-related (gray line) and deviant-related (black line) activity for the four different test frequencies (top row) and the difference in activity (deviant − standard; bottom row) depicted in PSTHs (2 ms bin width). The pure tone frequency is indicated above each column. The number of the stimulation pair for this frequency is given in the top right corner of each difference PSTH in the bottom row, with the percentage DS-difference value stated beneath.
Figure 7.
Figure 7.
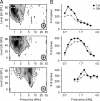
Example of frequency-specific differences in adaptation in five vMGB units recorded simultaneously from five different recording channels. The units were tested in a reduced oddball paradigm that allowed for testing an extended range of frequencies at the expense of a reduced number of standard/deviant comparisons (200 times). A, Frequency response areas with the tuning curve in each plot marked by the dashed black line. White points at 60 dB SPL indicate the tested frequencies (600, 714, 849, 1009, 1200, 1427, 1697, and 2018 Hz). The number in the gray circle (bottom right corner) identifies the recording channel. Areas enclosed in solid black lines exhibit an activity level exceeding the mean plus 1 SD of the interstimulus activity level. Activity encoded in grayscale as indicated in Figure 5. B, Plots to the right of each frequency response area show for each respective unit the absolute spike sum for standard (gray) and deviant (black) tones at the different test frequencies. Only data from frequencies inside the corresponding frequency response area are displayed.
Figure 8.
Figure 8.
Time course of adaptation indicates that the fast habituating responses to standard stimuli predominantly determine DS differences. A, Average time course of normalized response activity from 100 units tested in the oddball paradigm (2 frequencies per unit). The plots show normalized spike activity, separated for deviant responses (top plot) and standard responses (bottom plot), averaged across the tested frequencies for all 1000 trials in a block (n = 200; median with interquartile range). Each data point included in the trial average includes itself the summed spikes from five repeated blocks, normalized to the maximal summed activity per trial for a given test frequency and unit. Black line denotes in both plots the grand median (value given as a number on the right). B, Time course of response activity in a close-up view of the median values of the first 200 consecutive trials (black dots for deviant tones, gray for standard tones). Black lines denote exponential functions fitted to both time courses. Numbers and ticks on the right side indicate the level of grand median activity. C, Time course of standard (gray) and deviant (black) activity (only medians are shown for the 1000 trials), same as in A, but divided into three temporal sections (trials 1–5, 6–120, and 121–1000). Activities are fitted by linear functions (y = c1 + c2 * x), in the middle and right plot separately for standard and deviant stimuli. Numbers and ticks on the right side indicate the level of grand median activity. D, Same type of illustration as in C but dataset (n = 200) split up into four different classes (organized in rows) according to the DS-difference values. Top numbers to the right indicate the DS-difference category and the bottom number in brackets the sample size. Activity in each temporal section is fitted by a linear function, in the middle and right plot separately for standard and deviant stimuli. E, Median spike activity levels (n = 200) for deviant tones (marked as asterisks), the preceding standard tones (triangles), and the following standard tones (circles) as a function of the number of standard tones in between deviants. Thin gray lines connect the level of deviant responses with the preceding and following standard response. The deviant response after two standards (far left asterisk) was pairwise tested against the deviant responses with more standard tones between using a signed rank test. Asterisks in the top part of the plot indicate the level of significance (*p < 0.05, **p < 0.01, ***p < 0.001). Significantly higher levels of activity in deviant responses occurred with increasing number of intermediate standard tones. The bold black line represents a linear fit to the deviant levels (y = 0.064 * (# of standard tones) + 68).
Figure 9.
Figure 9.
Example recording of DS differences determined with the roving oddball paradigm. A, Frequency response areas of three simultaneously recorded units. The level of activity encoded in grayscale as in Figure 5; recording channel numbers are indicated in the bottom right corners. Units were tested in a paradigm using 11 different frequencies (714, 849, 1009, 1200, 1427, 1697, 2018, 2400, 2854, 3394, and 4036 Hz). Frequencies are marked with white dots in the response plot at 60 dB SPL. B, Corresponding DS differences for each unit to the left noted as separate curves of spike sums for the first tone (deviant, black) and the fifth tone (standard, gray) within a five-tone stimulus train determined at different test frequencies. Only data from frequencies inside the corresponding frequency response area were analyzed.
Figure 10.
Figure 10.
Population analysis for data recorded in the roving oddball paradigm. A, Average DS difference (1st/5th) determined in the roving oddball paradigm (n = 532 frequencies in 92 units). Data were calculated by comparing responses to the first tone (deviant) with responses to the fifth tone (standard) of the five-tone stimulus train. Data from the oddball paradigm, already given in Figure 2, were redrawn to the right for comparison. B, Time course of response activity to the five consecutive tones in the five-tone stimulus train normalized to the frequency-specific maximum spike sum per trial of a given unit (median with interquartile range). The first tone (deviant, black) and the fifth tone (standard, gray) are used to calculate DS differences. C, Comparison of activity levels (median ± interquartile range of the number of spikes per trial) at specific frequencies (60 dB SPL), tested in all of the following stimulus configurations: in the FRA, the FRC, and the roving oddball paradigm (1st and 5th tone of the five-tone stimulus train). Tests based on the two-sample Kolmogorov–Smirnov test are drawn in black, and those based on the Wilcoxon's signed rank test are colored in gray. Significant differences are indicated at the top with the level of significance encoded as **p < 0.01, ***p < 0.001. D, Population data recorded in the oddball paradigm comparable with the roving oddball effects (n = 100, as shown in Fig. 2). Left side (1st/5th): Trial-specific differences in activity (comparable with DS difference) between the first standard tone and the fifth standard tone (roving oddball substitute). Right side (8th/7th): Trial-specific differences in activity between the first deviant (trial 8) and the preceding standard tone (trial 7). Data for relative low and high frequency (f1, f2) are combined per unit to compensate for the small number of repetitions (5 per frequency and unit). E, Direct comparison of the DS differences in the oddball paradigm (left, 200 single trials per given frequency in the standard and the deviant position) and the roving oddball paradigm (right, 240 single trials per given frequency for the 1st and 5th position) recorded in the same set of neurons at corresponding frequencies (n = 52). Frequency data were included, if both frequencies of a stimulation pair within the oddball paradigm were located inside the tuning curve and fulfilled the stability criteria (see Material and Methods). F, Dependence of DS difference on the relative frequency position at 60 dB SPL in vMGB units. The positions of test frequencies were determined as relative positions in the frequency response area between the center (50%) and the closer frequency boundaries (0%; either top or bottom one) of the frequency response area for 129 frequencies recorded from 22 units. Depicted are normalized absolute DS differences (1st vs 5th tone in the roving oddball paradigm) as a function of the relative frequency position (gray dots). The median of all data points within a 10% distance step are shown in black.
Figure 11.
Figure 11.
Roving oddball paradigm in the vMGB combined with cortical inactivation. A, Four examples of frequency response areas of vMGB units recorded in four different experiments (same type of illustration and annotations as in Fig. 9A) representing the whole frequency range covered. The level of activity is encoded in grayscale and additional information noted as in Figure 5. The roving oddball paradigm was performed using 11 frequencies (at 60 dB SPL) separated by 0.25 octaves in a range adjusted to the response range of the unit (top, 600–3394 Hz; top middle, 714–4036 Hz; bottom middle, 3394–20,938 Hz; bottom, 4036–24,900 Hz). Position of test frequencies are marked with white dots in the response plot at 60 dB SPL. B, Corresponding levels of activity depending on stimulation frequency for the first tone (deviant, black) and the fifth tone (standard, gray). Spike numbers were normalized to maximum spike sum activity elicited by the fifth tone within a given panel to compensate for the reduced activity level after muscimol application. Panels in the left column in B display normalized spike sums before application of muscimol to the auditory cortex (AC) and panels in the right column after cortical inactivation. Examples in each row are numbered as noted in the top right corner from top to bottom (boxed numbers). Only data from frequencies inside the corresponding frequency response area were analyzed. C, Test recordings of frequency response curves from the four example units shown in A using 25 frequencies ranging from 600–38,400 Hz (spacing 0.25 octaves) and comparing the activity before (dotted line) and after (solid line) application of muscimol to the auditory cortex. Boxed numbers in the top right corner of each panel indicate the example number. The frequency range marked with light gray (background) indicates the range of stimulation inside the corresponding tuning curve.
Figure 12.
Figure 12.
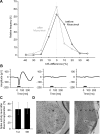
Cortical inactivation eliminates adaptation in the vMGB as indicated by the distribution of DS differences. A, Distribution of determined DS differences in vMGB units (n = 136 frequencies in 25 units) before (black) and after (gray) cortical inactivation with muscimol (bin size, 10%). B, Inactivation of the auditory cortex was monitored in recorded LFPs. The example given here shows the LFP in layer V before muscimol application (left), 30 min after muscimol application (middle), and at the end of the experiment (right). Black horizontal bar indicates stimulus duration (white noise, 50 dB SPL) to determine LFP responses. C, Spike activity levels (median ± interquartile range) of the first and the fifth tone in the roving oddball paradigm after muscimol application as percentage values of the spike sum obtained before muscimol application. Muscimol caused an overall median decrease in activity levels of 35.8% in the vMGB. D, Examples of histological verification of electrode positions. Left, Coronal section through the MGB with lesions indicating the position of recording channels 1 and 16 (asterisk). Scale bar, 200 μm. v, Ventral part of the MGB; d, dorsal part of the MGB. Right, Lesion in layer V of the auditory cortex indicating the electrode position for recording LFPs. Scale bar, 200 μm. Cortical layers are indicated by Roman numerals. One thalamic recording example corresponding to the histological data in D as well as the LFPs in B is given in Figure 11A (bottom).

References

    1. Abel C, Kössl M. Sensitive response to low-frequency cochlear distortion products in the auditory midbrain. J Neurophysiol. 2009;101:1560–1574. - PubMed
    1. Allen TA, Narayanan NS, Kholodar-Smith DB, Zhao Y, Laubach M, Brown TH. Imaging the spread of reversible brain inactivations using fluorescent muscimol. J Neurosci Methods. 2008;171:30–38. - PMC - PubMed
    1. Anderson LA, Christianson GB, Linden JF. Stimulus-specific adaptation occurs in the auditory thalamus. J Neurosci. 2009;29:7359–7363. - PMC - PubMed
    1. Antunes FM, Covey E, Malmierca MS. Is there stimulus-specific adaptation in the medial geniculate body of the rat? In: Lopez-Poveda EA, Palmer AR, Meddis R, editors. The neurophysiological bases of auditory perception. New York: Springer; 2010. pp. 535–544.
    1. Arcelli P, Frassoni C, Regondi MC, De Biasi S, Spreafico R. GABAergic neurons in mammalian thalamus: a marker of thalamic complexity? Brain Res Bull. 1997;42:27–37. - PubMed

Publication types