. 2011 Aug 1;187(3):1192-200.
doi: 10.4049/jimmunol.1100695. Epub 2011 Jun 29.

CD8+ T cells primed in the periphery provide time-bound immune-surveillance to the central nervous system

Affiliations

CD8+ T cells primed in the periphery provide time-bound immune-surveillance to the central nervous system

Kevin G Young et al. J Immunol. .

Abstract

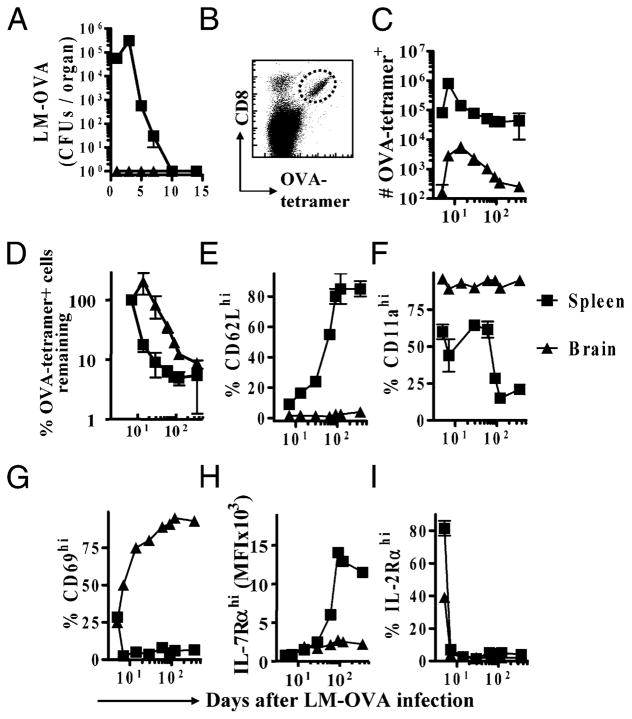
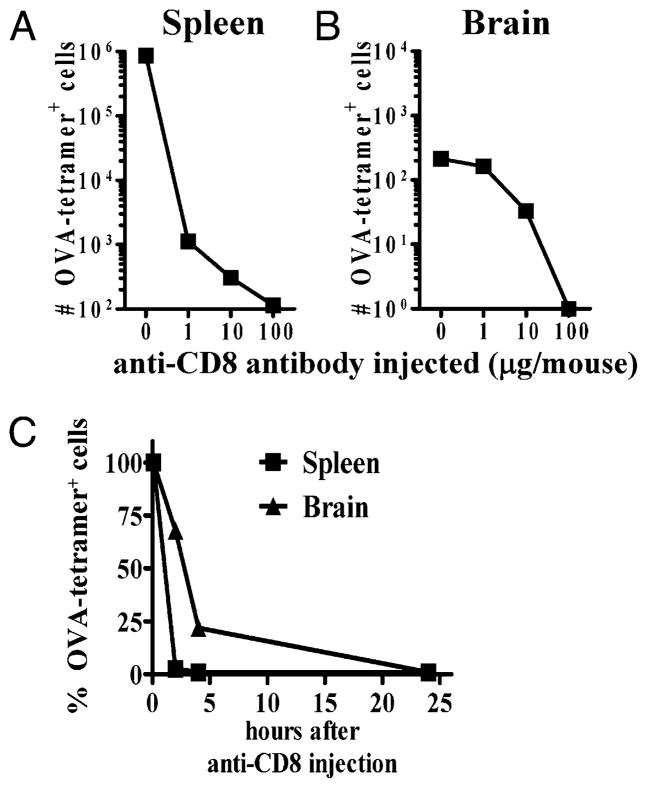
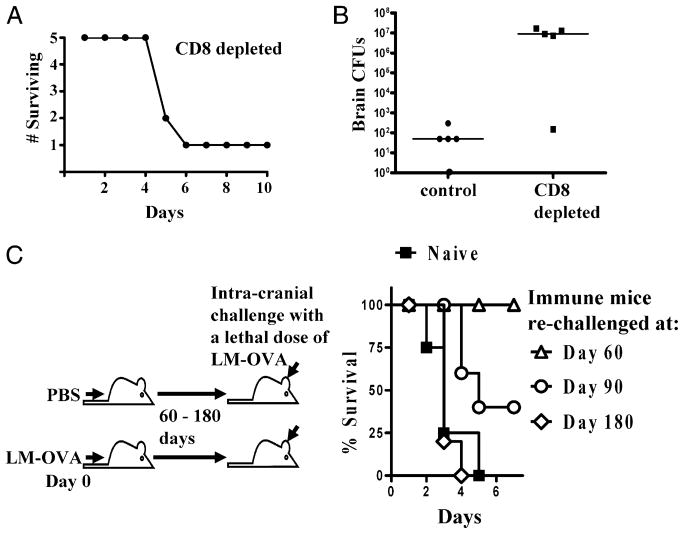
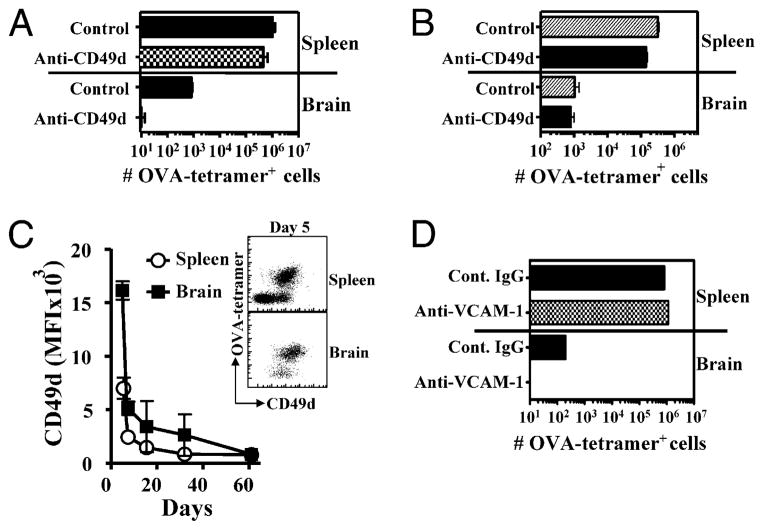
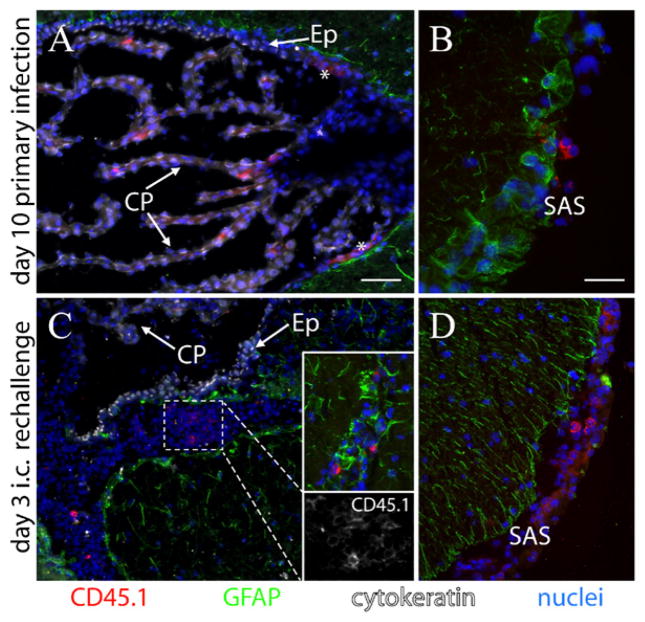
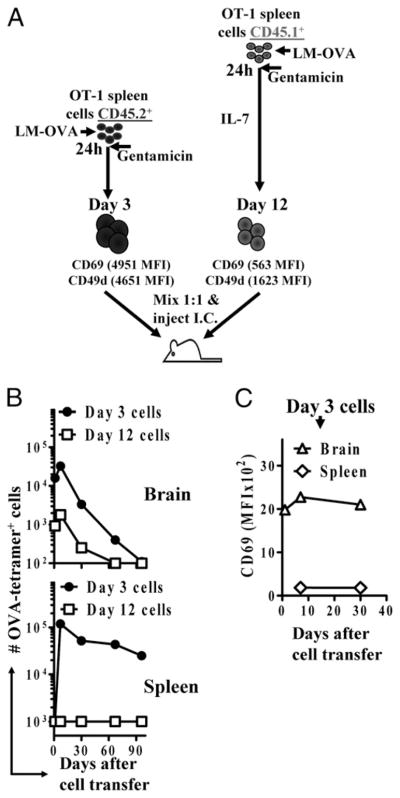
After vaccination, memory CD8(+) T cells migrate to different organs to mediate immune surveillance. In most nonlymphoid organs, following an infection, CD8(+) T cells differentiate to become long-lived effector-memory cells, thereby providing long-term protection against a secondary infection. In this study, we demonstrated that Ag-specific CD8(+) T cells that migrate to the mouse brain following a systemic Listeria infection do not display markers reminiscent of long-term memory cells. In contrast to spleen and other nonlymphoid organs, none of the CD8(+) T cells in the brain reverted to a memory phenotype, and all of the cells were gradually eliminated. These nonmemory phenotype CD8(+) T cells were found primarily within the choroid plexus, as well as in the cerebrospinal fluid-filled spaces. Entry of these CD8(+) T cells into the brain was governed primarily by CD49d/VCAM-1, with the majority of entry occurring in the first week postinfection. When CD8(+) T cells were injected directly into the brain parenchyma, cells that remained in the brain retained a highly activated (CD69(hi)) phenotype and were gradually lost, whereas those that migrated out to the spleen were CD69(low) and persisted long-term. These results revealed a mechanism of time-bound immune surveillance to the brain by CD8(+) T cells that do not reside in the parenchyma.


Conflict of interest statement

The authors have no financial conflicts of interest.

Figures

FIGURE 1
FIGURE 1
Ag-specific CD8+ T cells in the brain display a persistently activated phenotype in response to a peripheral infection. C57BL/6J mice were infected i.v. with LM-OVA (104). At various time intervals, spleens and brains were removed from mice after cardiac perfusion. A, Cell suspensions were prepared, and serial dilutions were plated on BHI agar plates to determine the bacterial burden (CFU/organ). B–I, C57BL/6J mice were injected i.v. with 1 × 10³ OT-1 TCR transgenic CD8+ T cells and challenged within 5–7 d with LM-OVA (1 × 10⁴, i.v.). At various time intervals postinfection, spleens and brains were removed from mice after cardiac perfusion. B, Cells were stained with OVA-tetramer and anti-CD8 Abs and analyzed by flow cytometry. C, The numbers of OVA-tetramer+ CD8+ T cells in the brain and spleen were evaluated. D, To compare the rates of attrition, the percentage of cells remaining past day 5 postinfection were calculated, with numbers at the day 7 time point set as 100%. Cells were also stained with Abs against CD62L (E), CD11a (F), CD69 (G), IL-7Rα (H), and IL-2Rα (I), and the expression of these molecules on OVA-tetramer+ CD8+ T cells was evaluated in the brain and spleen. Each experiment involved the analysis of at least four mice/group and was repeated at least twice.
FIGURE 2
FIGURE 2
The endogenous CD8+ T cell response in various organs following LM-OVA infection. Spleens, lungs, livers, and brains were collected 30 d following i.v. infection of C57BL/6J mice with LM-OVA (1 × 10⁴). No OT-1 cells were used in this case. A, The numbers of OVA-specific CD8+ T cells in each organ were quantified by FACS analysis. B, The percentage of OVA-specific CD8+ T cells expressing high levels of CD62L and IL-7Rα was assessed by FACS analysis at various time points over a 35-d period following LM-OVA infection (1 × 10⁴, i.v.). This was assessed from spleens, lungs, livers, brains, and peripheral blood (PBL). Each experiment involved analysis of at least four mice/group and was repeated at least twice.
FIGURE 3
FIGURE 3
Normal function of CD8+ T cells in the brain. C57BL/6J mice were injected with OT-1 and infected with LM-OVA, as described in Fig. 1. Three days prior to the harvest of spleens and brain, BrdU (0.8 mg/ml) was incorporated into the drinking water of mice, which was changed daily. A, Cells were stained with anti-CD8 Abs and OVA-tetramers, followed by intracellular staining for BrdU. Numbers in the graph indicate the percentage of BrdU+ CD8+ T cells among the tetramer+ cells. B, Numbers of IFN-γ–secreting tetramer+ CD8+ T cells were evaluated after staining cells first with OVA-tetramers and anti-CD8 Ab, followed by the stimulation of cells for 1 h with OVA257–264 peptide. Numbers in the figure indicate the percentage of IFN-γ-secreting CD8+ T cells among the tetramer+ cells. C, The percentage of OVA-tetramer+ CD8+ T cells expressing IFN-γ in spleen, lungs, and brain collected at day 30 postinfection, as assessed by flow cytometry. Each experiment involved analysis of at least four mice/group and was repeated at least twice.
FIGURE 4
FIGURE 4
Systemic administration of anti-CD8 Ab deletes CD8+ T cells in the brain. C57BL/6J mice were injected i.v. with OT-1 and LM-OVA (1 × 10⁴), as described in Fig. 1. At day 30 after primary infection, mice were injected i.p. with different amounts of anti-CD8 depletion Ab (clone 2.43) and evaluated for the reduction in the numbers of OVA-specific CD8+ T cells in the spleen (A) and brain (B) at 24 h. C, Also at day 30, mice were injected i.p. (100 μg, once) with depleting anti-CD8 Ab, and tissues were collected over a 24-h time period. At various times post-Ab injection, spleens and brains were removed, and the relative numbers of OVA-tetramer+ CD8+ T cells were evaluated by flow cytometry. The numbers of OVA-tetramer+ CD8+ T cells in the control Ab-treated mice were factored to 100%, and the relative numbers in anti-CD8 Ab-treated mice were evaluated relative to control Ab-treated mice. Each experiment involved analysis of at least four mice/group and was repeated at least twice.
FIGURE 5
FIGURE 5
Time-bound protection against LM-OVA rechallenge in the brain. C57BL/6J mice were injected i.v. with LM-OVA (1 × 10⁴) in each experiment. A, To examine the ability of mice to clear a secondary LM-OVA infection in the brain, we first examined the survival of a group of mice that had CD8+ T cells depleted using the anti-CD8 clone 2.43 Ab (see Materials and Methods and Fig. 4 for additional information). These mice were rechallenged with an i.c. infection (1 × 10² LM-OVA in 5 μl) 2 wk following the initial i.v. infection. All mice lived for 4 d following the rechallenge, with one mouse surviving well beyond this. This mouse was sacrificed at day 10 with no apparent illness or weight loss. B, Two more groups of five mice had 1 × 10³ OT-1 splenocytes adoptively transferred i.v. and then were infected i.v. with 1 × 10⁴ LM-OVA. Two weeks later, these mice received either i.p. injections of CD8 cell-depletion Ab or a PBS control. We then administered an i.c. rechallenge of 1 × 10² LM-OVA and collected brains 3 d thereafter. The bacterial burden (CFU) was determined with serial dilutions plated on BHI agar plates. Complete CD8+ cell depletion was confirmed by a FACS analysis of spleens using anti-CD8-labeling Ab in the experiments in A and B (data not shown). C, At days 60, 90, or 180 post-i.v. infection, mice were challenged i.c. with LM-OVA in 5 μl, and the survival of mice was monitored. A >20% reduction in the weight of mice was scored as moribund, and mice were sacrificed at that point. This experiment involved the analysis of five mice/group and was repeated twice.
FIGURE 6
FIGURE 6
CD49d/VCAM-1 mediated homing of CD8+ T cells to the brain postinfection. A and B, C57BL/6J mice were injected with OT-1 and LM-OVA (1 × 10⁴), as described in Fig. 1. Separate groups of mice received Abs against CD49d i.p.: 100 μg each on days 2–6 (A) or on days 62–66 after LM-OVA infection (B). Control mice received normal rat IgG. Twenty-four hours after the last Ab injection, brains were removed, and the relative numbers of OVA-tetramer+ CD8+ T cells were evaluated after staining cells with anti-CD8 Abs and OVA-tetramers. C, C57BL/6J mice were injected with OT-1 and LM-OVA (1 × 10⁴), as described in Fig. 1, and the expression of CD49d on OVA-tetramer+ CD8+ T cells in the spleen and brain was evaluated at various time intervals. D, C57BL/6 mice were treated as in A, with anti–VCAM-1–blocking Ab; isotype-matched control IgG was used for the i.p. injections. Brains were removed 24 h after the last Ab injection, and the relative numbers of OVA-tetramer+ CD8+ T cells were evaluated after staining cells with anti-CD8 Abs and OVA-tetramers. Experiments in A–C involved analysis of at least four mice/group and were repeated at least twice; the experiment in D involved the analysis of four mice and was performed once.
FIGURE 7
FIGURE 7
CD8+ T cell migration into the brain following systemic LM-OVA infection and i.c. rechallenge. A and B, Photomicrographs taken 10 d post-i.v. injection of LM-OVA (1 × 10³) into a CD45.2+ host previously injected with CD45.1+ OT-1 CD8+ T cells, as described in Fig. 1. In the brain, CD45.1+ cells were found only in the CP (A) and the SAS (B). Asterisks in A denote diffuse staining, consistently observed near the ependymal (Ep)–CP transition zone of the third ventricle with CD45.1 Ab (shown) and CD8 Ab (not shown). C, At day 30 after vaccination, we rechallenged a group of vaccinated mice with LM-OVA i.c. (1 × 10³). Three days later, masses of cells had moved into a space on the parenchymal side of the ependymal lining of the third ventricle. Only a subset of these was CD45.1+ cells (bottom inset; CD45.1 staining alone is shown from a cluster of these cells). Individual CD45.1+ cells were also observed in the parenchyma in the region of the brain near the injection site (top inset). The other prominent location of CD45.1+ cells at this time point, and later, was within the SAS (D). Scale bars, 50 μm (A, C, D) and 25 μm (B). Individual mice were evaluated at days 10 and 14 post-i.v. infection and days 3, 5, 7, and 10 post-i.c. rechallenge. All staining was repeated at least twice.
FIGURE 8
FIGURE 8
Activated CD8+ T cells that migrate out of the brain undergo a reduced contraction in the periphery. OT-1 spleen cells were stimulated in vitro for 3 d (CD45.2+) or 12 d (CD45.1+), as described in Materials and Methods. A, CD8+ T cells were quantified and mixed 1:1 and injected i.c. (~106/mouse) into the anterior forebrain of naive C57BL/6J recipients. At various time intervals, the numbers of CD45.1+ and CD45.2+ OVA-specific CD8+ T cells (B) and the expression of CD69 (C) were evaluated in the spleen and brain of recipient mice by flow cytometry. Each experiment involved the analysis of at least four mice/group and was repeated at least twice.
FIGURE 9
FIGURE 9
Ag-specific CD8+ T cells injected into the parenchyma can migrate into the CP. OVA-specific CD8+ T cells were generated, as described in Fig. 8, and used at day 3 following activation. A, Horizontal profile of an embedded, sectioned mouse brain injected with activated OT-1 CD8+ T cells. The injections were placed in the upper left region of the brain (red circle). B, A cluster of CD45.1+ cells (shown) and CD8+ cells (not shown) were easily observable near the bottom of the injection tracts. Outside of the injection tracts, cells were mainly found in CSF-filled spaces. In the lateral ventricle on the side ipsilateral to the injection, CD45.1+ (shown) and CD8+ (not shown) cells could be found entering into and within the CP at 1 d (C) and 3 d (D) postinjection. Scale bars, 50 μm (B) and 25 μm (C, D). Two mice each were evaluated at 1 and 3 d post-injection, and staining was repeated at least twice. lv, lateral ventricle; 3rd v, third ventricle.

References

    1. Hayashi T, Nagai S, Fujii H, Baba Y, Ikeda E, Kawase T, Koyasu S. Critical roles of NK and CD8+ T cells in central nervous system listeriosis. J Immunol. 2009;182:6360–6368. - PubMed
    1. Edelson BT, Unanue ER. Immunity to Listeria infection. Curr Opin Immunol. 2000;12:425–431. - PubMed
    1. Unanue ER. Inter-relationship among macrophages, natural killer cells and neutrophils in early stages of Listeria resistance. Curr Opin Immunol. 1997;9:35–43. - PubMed
    1. Harty JT, Bevan MJ. Specific immunity to Listeria monocytogenes in the absence of IFN gamma. Immunity. 1995;3:109–117. - PubMed
    1. Kägi D, Ledermann B, Bürki K, Hengartner H, Zinkernagel RM. CD8+ T cell-mediated protection against an intracellular bacterium by perforin-dependent cytotoxicity. Eur J Immunol. 1994;24:3068–3072. - PubMed

MeSH terms

Substances

Grants and funding