. 2011 Sep;22(5):680-5.
doi: 10.1097/EDE.0b013e3182254cc6.

Does more accurate exposure prediction necessarily improve health effect estimates?

Affiliations

Does more accurate exposure prediction necessarily improve health effect estimates?

Adam A Szpiro et al. Epidemiology. 2011 Sep.

Abstract

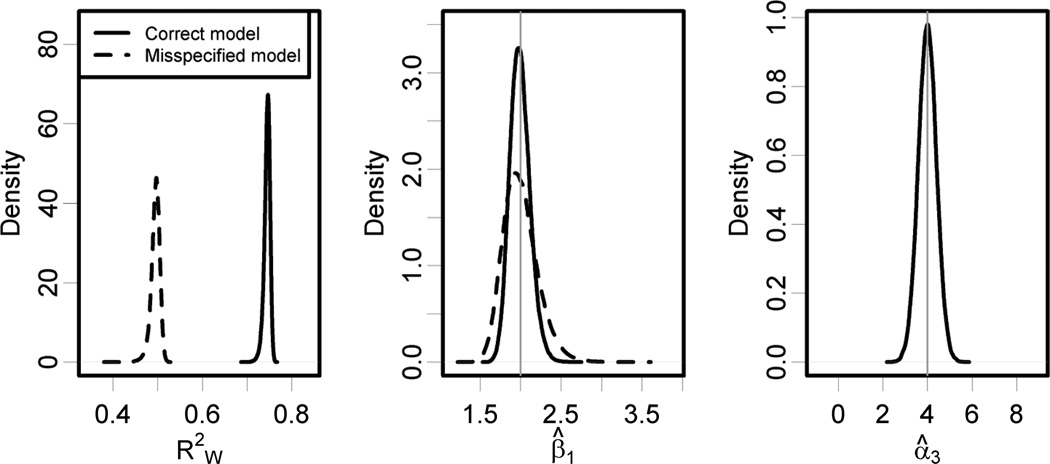
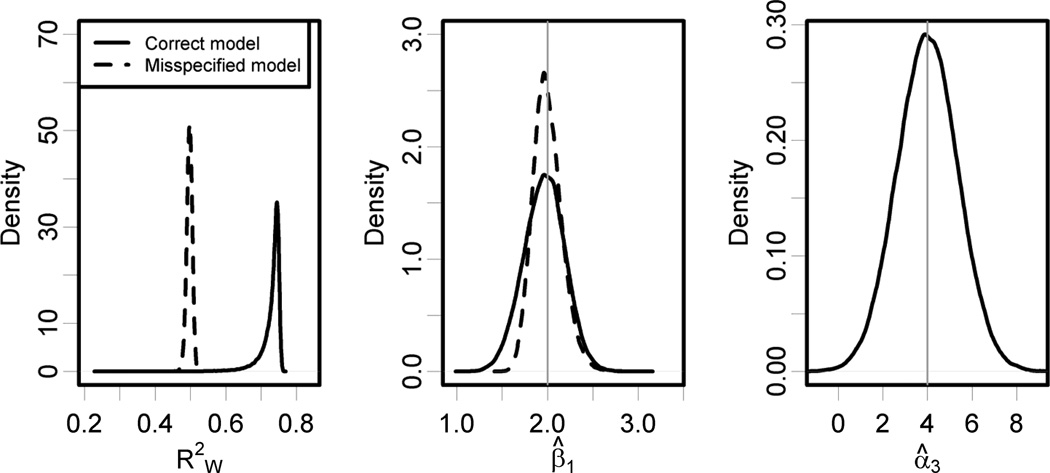
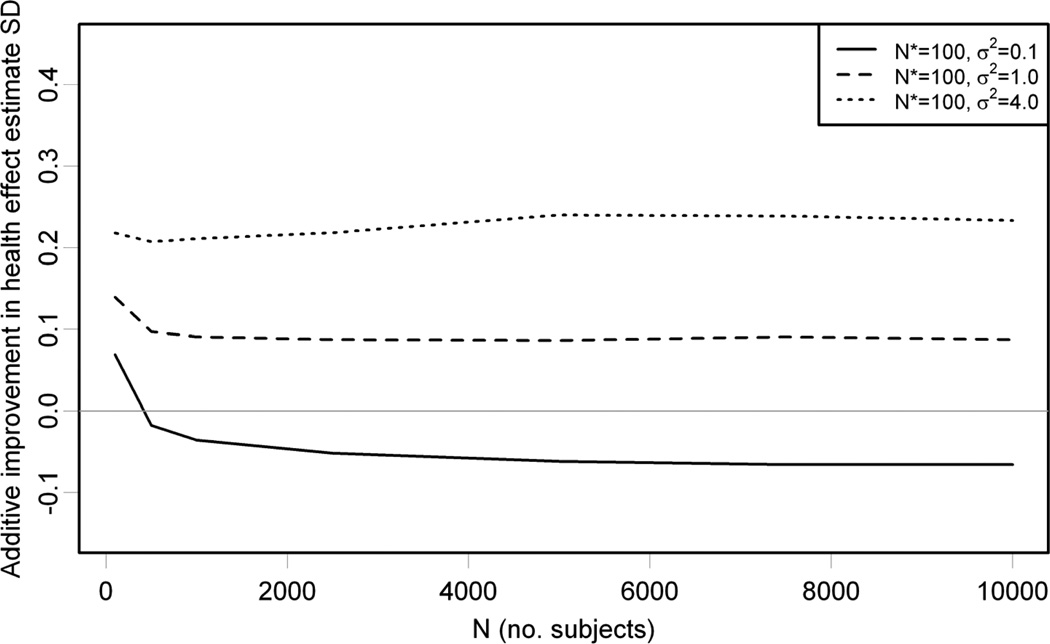
A unique challenge in air pollution cohort studies and similar applications in environmental epidemiology is that exposure is not measured directly at subjects' locations. Instead, pollution data from monitoring stations at some distance from the study subjects are used to predict exposures, and these predicted exposures are used to estimate the health effect parameter of interest. It is usually assumed that minimizing the error in predicting the true exposure will improve health effect estimation. We show in a simulation study that this is not always the case. We interpret our results in light of recently developed statistical theory for measurement error, and we discuss implications for the design and analysis of epidemiologic research.


Figures

Figure 1
Figure 1
Results from 80,000 Monte Carlo simulations with N = 10,000, N* = 100, and σ2 = 1.0. For the correctly specified exposure model the average out-of-sample prediction accuracy is R¯W2=0.74 and the health effect estimation standard deviation is 0.12 with a bias of −0.007 (95% CI = −0.008 to −0.006). Corresponding statistics for the misspecified exposure model are R¯W2 and health effect estimation standard deviation 0.21 with a bias of (95% CI = −0.002 to 0.0006). The standard error of α̂3 for the correctly specified model is 0.41, and α̂3 is statistically significant in all simulations.
Figure 2
Figure 2
Results from 80,000 Monte Carlo simulations with N = 10,000, N* = 100, and σ2 = 0.1. For the correctly specified exposure model the average out-of-sample prediction accuracy is R¯W2=0.73 and the health effect estimation standard deviation is 0.23 with a bias of −0.035 (95% CI = −0.037 to −0.034). Corresponding statistics for the misspecified exposure model are R¯W2 and health effect estimation standard deviation 0.16 with a bias of 0.001 (95% CI = −0.0003 to 0.002). The density plot for RW2 shows some small outliers for the full model, but the prediction accuracy is better than for the misspecified model in all but 144 of the 80,000 simulations. The standard deviation of α̂3 for the correctly specified model is 1.37, and α̂3 is statistically significant in 83% of simulations.
Figure 3
Figure 3
Results from 5,000 Monte Carlo simulations with N* = 100, σ2 = 0.1,1.0,4.0, and N ranging from 100 to 10,000. The vertical axis shows the difference between standard deviation (SD) of β̂X from the misspecified and correct exposure models. A positive difference indicates that the correctly specified model is more efficient. For all values of σ2, the average exposure model prediction accuracies are R¯W2 between 0.73 and 0.75 and R¯W2 between 0.49 and 0.50 0.50.N=N*=R¯W2Va¯r(W)RW2α^3β^Xβ^Xβ^X0.001N=N*=σ2=1.0R¯W2=0.740.120.007R¯W2=0.490.210.001α^30.41α^3N=N*=σ2=0.1R¯W2=0.730.230.035R¯W2=0.500.160.001RW2144α^31.37α^3N*=σ2=0.1,1.0,4.0Nβ^Xσ2R¯W20.730.75R¯W20.490.50.

References

    1. Yanosky JD, Paciorek CJ, Suh H. Predicting chronic fine and coarse particulate exposure using spatio-temporal models for the northeastern adn midwestern US. Environmental Health Perspectives. 2009;117:522–529. - PMC - PubMed
    1. Szpiro A, Sampson PD, Sheppard L, Lumley T, Adar SD, Kaufman JD. Predicting intra-urban variation in air pollution concentrations with complex spatio-temporal dependencies. Environmetrics. 2010;21(4):606–631. - PMC - PubMed
    1. Brauer M. How much, how long, what, and where: Air pollution exposure assessment for epidemiologic studies of respiratory disease. Proceedings of the American Thoracic Society. 2010;7:111–115. - PubMed
    1. Fanshawe TR, Diggle PJ, Rushton S, Sanderson R, Lurz PWW, Glinianaia SV, et al. Modelling spatio-temporal variation in exposure to particulate matter: a two-stage approach. Environmetrics. 2008;19(6):549–566.
    1. Su JG, Jerrett M, Beckerman B, Wilhelm M, Ghosh JK, Ritz B. Predicting traffic-related air pollution in Los Angeles using a distance decay regression selection strategy. Environmental Research. 2009;109(6):657–670. - PMC - PubMed

Publication types

MeSH terms