Review
. 2012 Jan 2;59(1):25-35.
doi: 10.1016/j.neuroimage.2011.06.037. Epub 2011 Jun 21.

A selective review of simulated driving studies: Combining naturalistic and hybrid paradigms, analysis approaches, and future directions

Affiliations
Review

A selective review of simulated driving studies: Combining naturalistic and hybrid paradigms, analysis approaches, and future directions

V D Calhoun et al. Neuroimage. .

Abstract

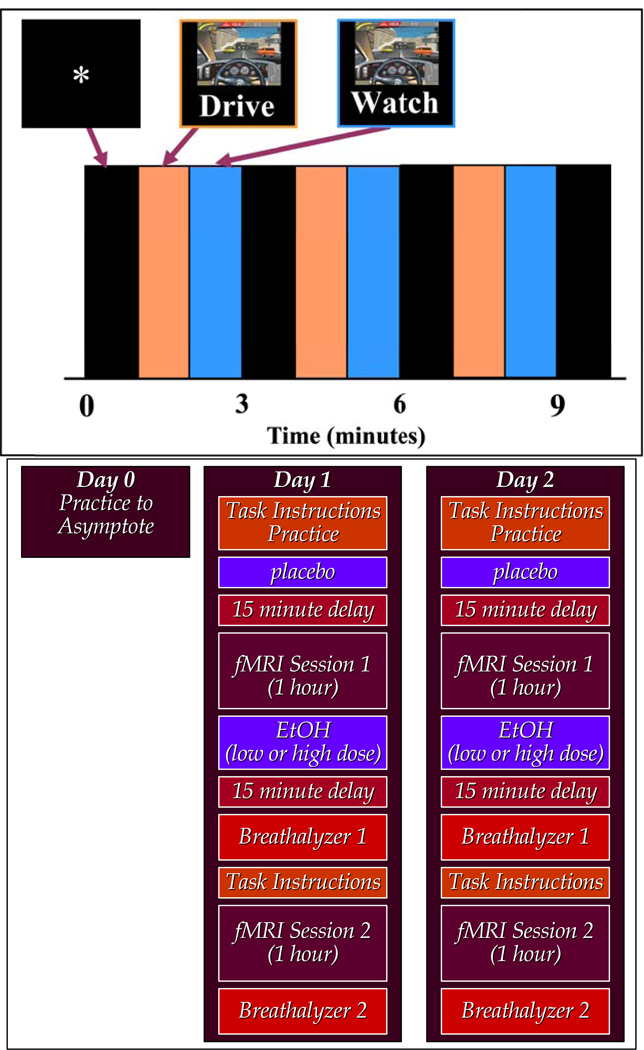
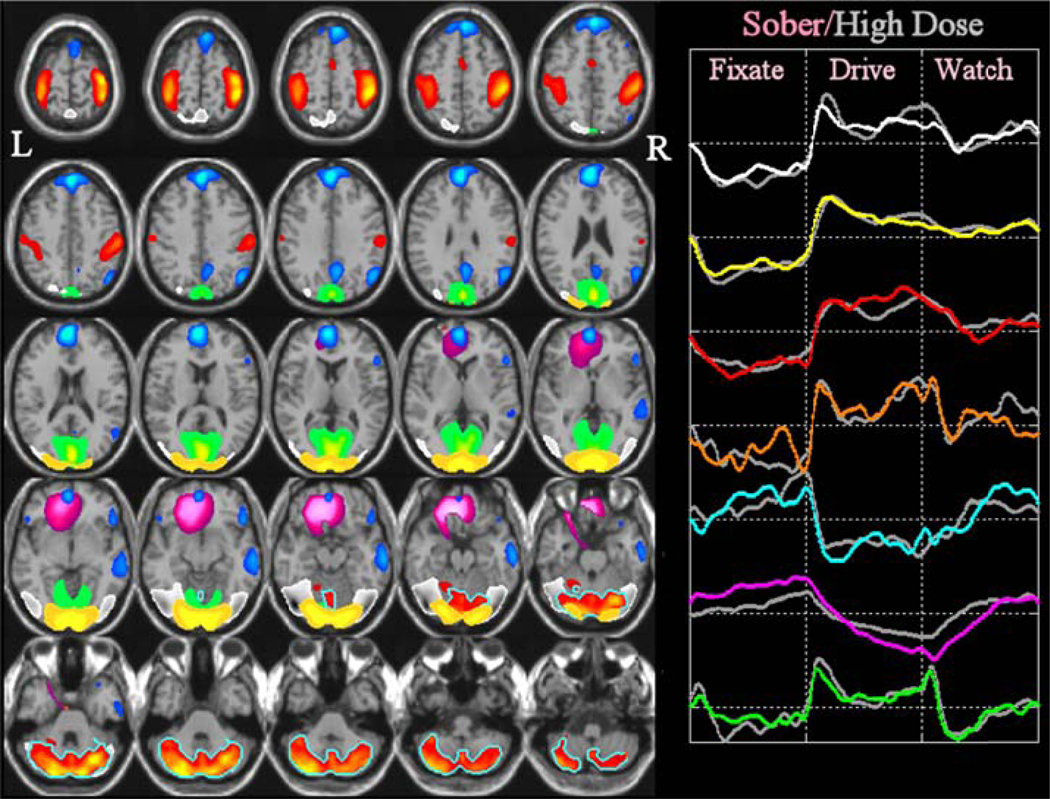
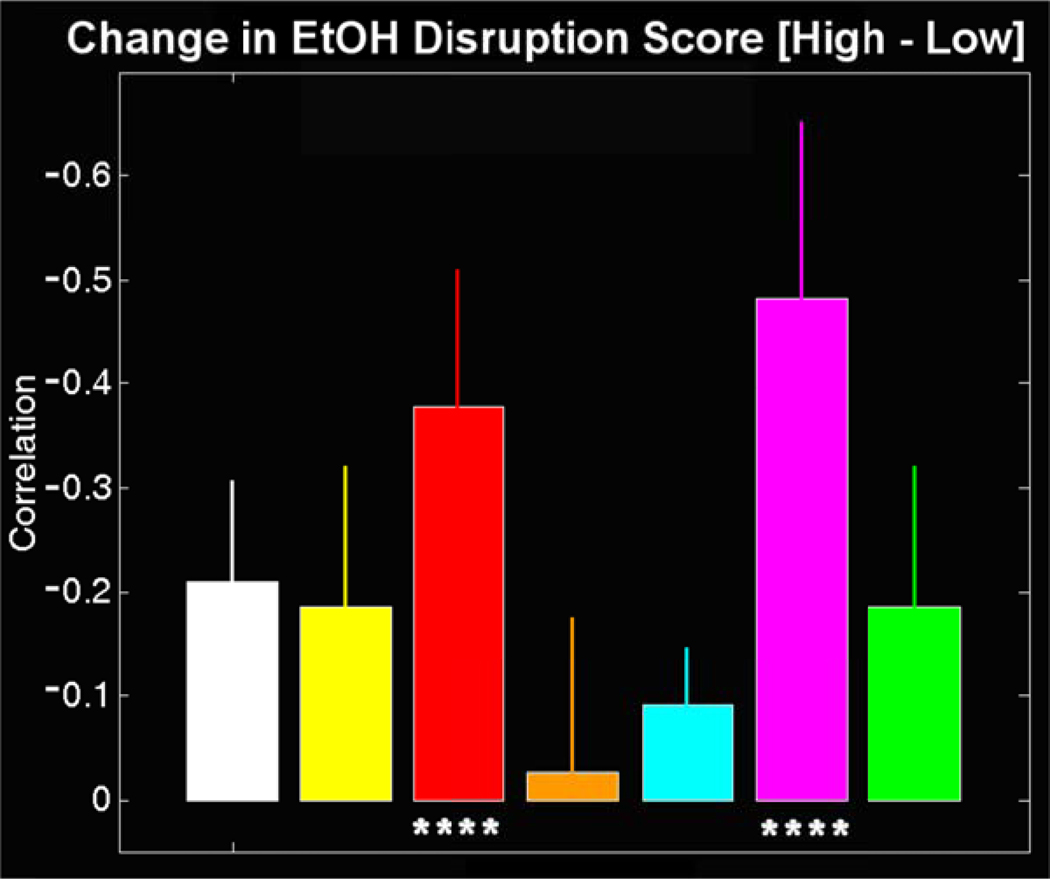
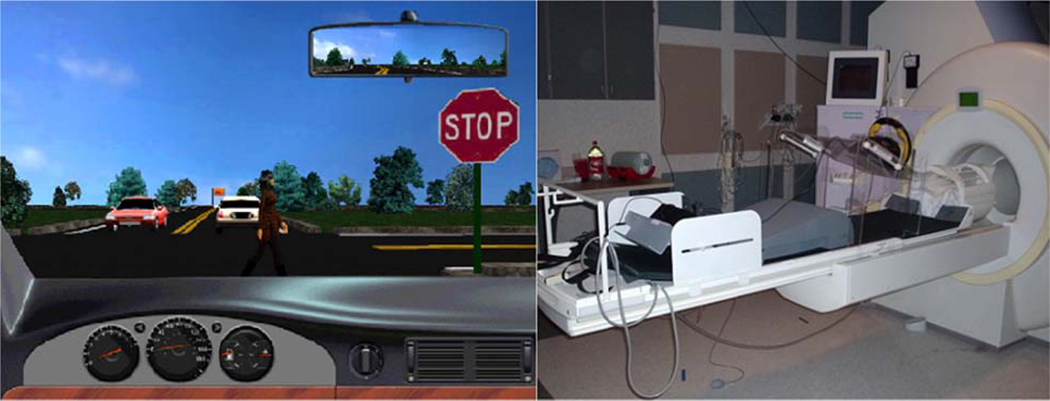
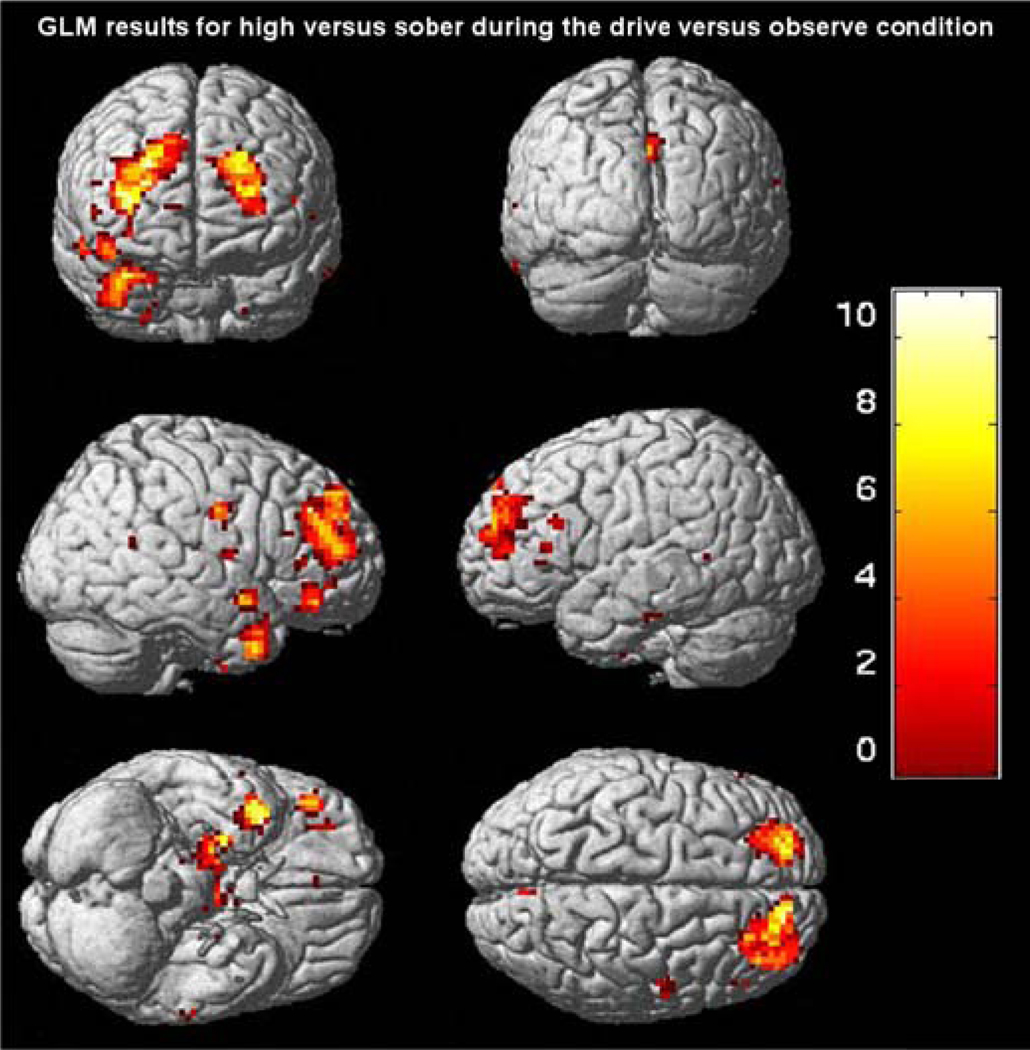
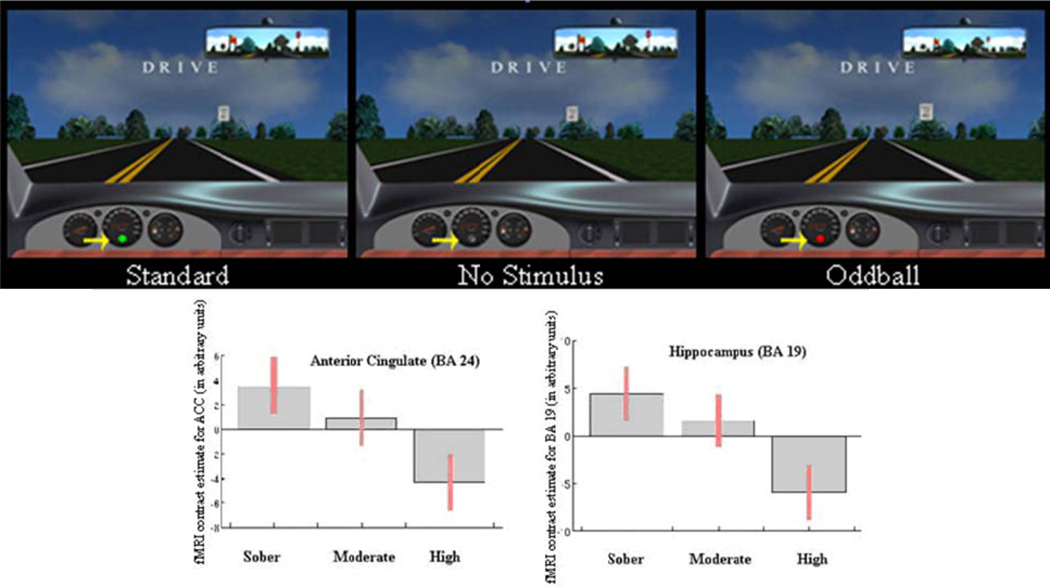
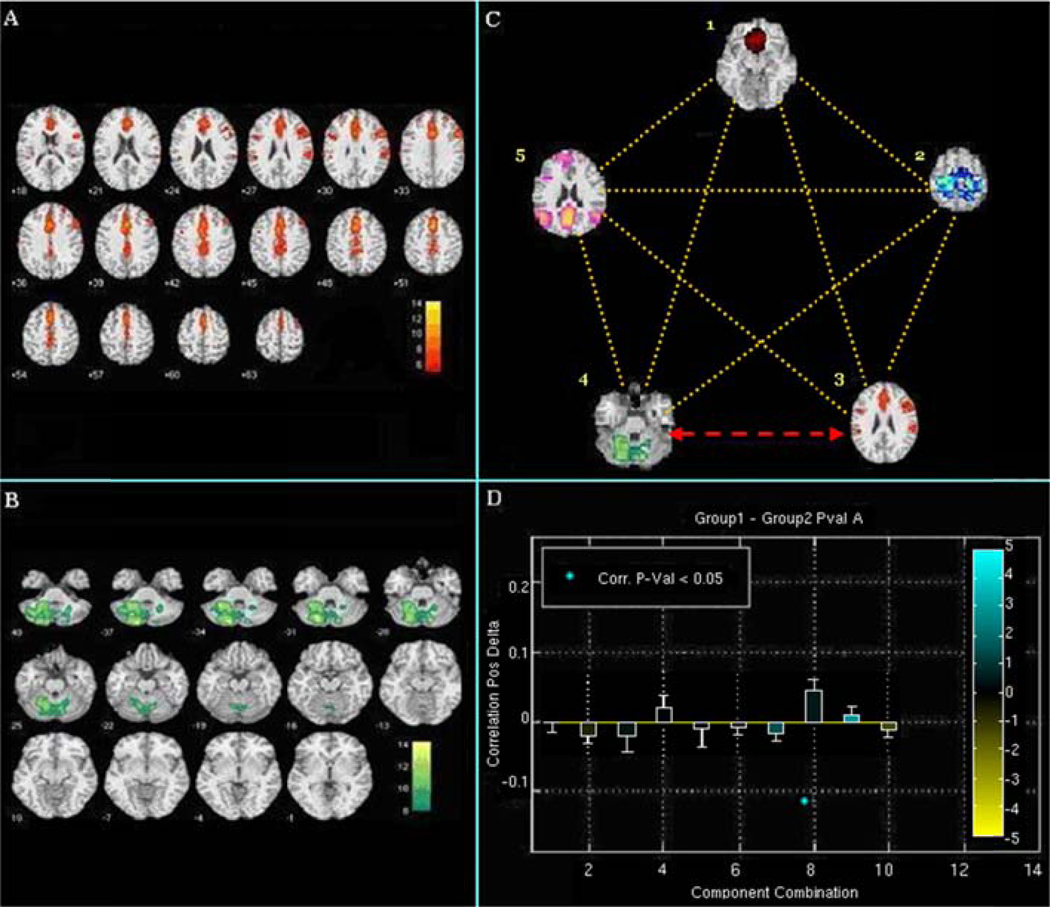
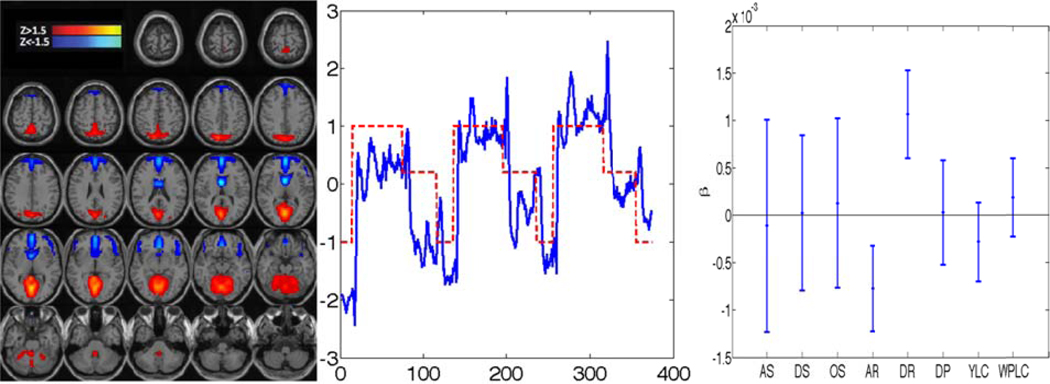
Naturalistic paradigms such as movie watching or simulated driving that mimic closely real-world complex activities are becoming more widely used in functional magnetic resonance imaging (fMRI) studies both because of their ability to robustly stimulate brain connectivity and the availability of analysis methods which are able to capitalize on connectivity within and among intrinsic brain networks identified both during a task and in resting fMRI data. In this paper we review over a decade of work from our group and others on the use of simulated driving paradigms to study both the healthy brain as well as the effects of acute alcohol administration on functional connectivity during such paradigms. We briefly review our initial work focused on the configuration of the driving simulator and the analysis strategies. We then describe in more detail several recent studies from our group including a hybrid study examining distracted driving and compare resulting data with those from a separate visual oddball task (Fig. 6). The analysis of these data was performed primarily using a combination of group independent component analysis (ICA) and the general linear model (GLM) and in the various studies we highlight novel findings which result from an analysis of either 1) within-network connectivity, 2) inter-network connectivity, also called functional network connectivity, or 3) the degree to which the modulation of the various intrinsic networks were associated with the alcohol administration and the task context. Despite the fact that the behavioral effects of alcohol intoxication are relatively well known, there is still much to discover on how acute alcohol exposure modulates brain function in a selective manner, associated with behavioral alterations. Through the above studies, we have learned more regarding the impact of acute alcohol intoxication on organization of the brain's intrinsic connectivity networks during performance of a complex, real-world cognitive operation. Lessons learned from the above studies have broader applicability to designing ecologically valid, complex, functional MRI cognitive paradigms and incorporating pharmacologic challenges into such studies. Overall, the use of hybrid driving studies is a particularly promising area of neuroscience investigation.


Figures

Figure 1
Figure 1
Timeline of the Simulated Driving Paradigm and Outline of 2-day Study Design for EtOH Experiments: The driving paradigm (top) consisted of ten, one-minute epochs of (a) a fixation target, (b) driving the simulator, and (c) watching a simulation while randomly moving fingers over the controller. Two-day study design (bottom) for EtOH experiments consists of two scan sessions on each day.
Figure 2
Figure 2
Results from the alcohol intoxication study: Group fMRI maps are thresholded at p<0.005 (corrected for multiple comparisons). A total of seven components are presented. A “green” component extends on both sides of the parieto-occipital sulcus including portions of cuneus, precuneus, and the lingual gyrus. A “yellow” component contains mostly occipital areas. A “white” component contains bilateral visual association and parietal areas; and a component consisting of motor areas is depicted in red. Cerebellar areas are also depicted in red (but with a turquoise border). Orbitofrontal and anterior cingulate areas identified are depicted in pink. Finally, a component including medial frontal, parietal, and posterior cingulate regions is depicted in blue. Group averaged time courses (right) for the fixate-drive-watch order are depicted with similar colors for the sober versus high-dose conditions (the drug condition is shown in gray). The three repeated epochs are averaged and presented as fixation, drive, and watch.
Figure 3
Figure 3
Differences in disruption scores for the ICA time courses: Within-day correlations were computed between the sober condition and the drug condition on the same day as a measure of the amount of disruption induced by the EtOH. The differences in these correlations are presented for each component with color corresponding to Figure 2. The high dose condition was in all cases less correlated with its sober counterpart than was the low dose condition (all values are negative). Significant (p<0.001) differences were observed for the pink (orbitofrontal/anterior cingulate) and red (motor) components only.
Figure 4
Figure 4
Screen Shot from Driving Simulator and Snapshot of Hardware setup: The picture on the left shows a typical screen shot taken from the driving simulation program. Pedestrians are a relatively common sight, as are cars, especially at intersections. The picture on the right shows the inside of the scanner room where the participant is scanned. The steering wheel is located just outside the scanner in a position comfortable for the participant. Pedals are located where the feet naturally fall in a position comparable to vehicle pedals.
Figure 5
Figure 5
GLM results for high versus sober during the drive versus observe condition: Regions that demonstrated a significantly lower functional activation (thresholded at p = 0.05 FDR corrected) during the high dose relative to placebo condition. Maps were derived from a random effects (RFX) repeated measures ANOVA comparing the three dosages conducted through a standard GLM analysis in SPM2
Figure 6
Figure 6
Response to oddball task at different EtOH doses: (top) Screen shots of the driving software, with arrow pointing to: 1. standard presentation; 2. no stimulus presentation; 3. oddball presentation. (bottom) Contrast plots showing the dose-dependent linear trend of the noted brain activations (BA 19, BA 24) in the targets vs. standard comparison.
Figure 7
Figure 7
Correlation differences of circuit combinations for sober versus alcohol condition: (A) Axial slices of basal ganglia component. (B) Axial slices of cerebellum component. (C) Image of all five independent critical driving-associated brain circuits (1) anterior cingulate, middle and orbito frontal gyri, (2) primary/secondary motor cortex, (3) fronto-basal ganglia, (4) cerebellum, and (5) resting state. Yellow dotted lines show network connections which do not differ significantly between baseline sober and alcohol intoxication conditions; the red arrow shows the network connection between the fronto-basal ganglia and cerebellar circuits which differs significantly between baseline sober and alcohol intoxication conditions (D) Graphical representation of correlations between different network combinations.
Figure 8
Figure 8
Example of CCA results integrating behavioral and imaging data: The group activation map is shown on the left, mean time course overlaid with the paradigm for three repetitions of [F]ixation-[D]riving-[W]atching in the middle, and confidence interval (CI) of behavioral correlation on the right. This map shows correlation in parieto-occipital regions and anticorrelation in medial frontal regions. The time course has high regression coefficients associated with the driving paradigm (0.48 ± 0.20)—indicating that the frontal and parieto-occipital brain regions are highly consistent across all the subjects when performing the driving task. Among the eight behavioral factors defined in Section 3.5, this component has significant association with the average and differential of steering weave.

Comment in

  • Expanding horizons in ergonomics research.
    Posner MI. Posner MI. Neuroimage. 2012 Jan 2;59(1):149-53. doi: 10.1016/j.neuroimage.2011.07.060. Epub 2011 Jul 24. Neuroimage. 2012. PMID: 21816226 Free PMC article. No abstract available.

References

    1. Motor vehicle traffic crash fatality counts and estimates of people injured for 2006. Administration NHTS. 2007
    1. Traffic Safety Facts-2007. Administration NHTS. 2008
    1. Abou-Elseoud A, Starck T, Remes J, Nikkinen J, Tervonen O, Kiviniemi V. The effect of model order selection in group PICA. Hum Brain Mapp. 2010;31(8):1207–1216. - PMC - PubMed
    1. Ahveninen J, Jaaskelainen IP, Pekkonen E, Hallberg A, Hietanen M, Naatanen R, Sillanaukee P. Global field power of auditory N1 correlates with impaired verbal-memory performance in human alcoholics. Neurosci.Lett. 2000;285(2):131–134. - PubMed
    1. Allen AJ, Meda S, Skudlarski P, Calhoun VD, Astur R, Ruopp K, Pearlson GD. Effects of alcohol on performance on a distraction task during simulated driving. Alcoholism: Clinical & Experimental Research. 2009;33(1):1–9. - PMC - PubMed

Publication types