. 2012 Aug;7(6):611-22.
doi: 10.1093/scan/nsr032. Epub 2011 Jun 29.

Pictures cueing threat: brain dynamics in viewing explicitly instructed danger cues

Affiliations

Pictures cueing threat: brain dynamics in viewing explicitly instructed danger cues

Florian Bublatzky et al. Soc Cogn Affect Neurosci. 2012 Aug.

Abstract

Recent event-related brain potential studies revealed the selective processing of emotional and threatening pictures. Integrating the picture viewing and threat-of-shock paradigm, the present study examined the processing of emotional pictures while they were explicitly instructed to cue threat of real world danger (i.e. electric shocks). Toward this end, 60 pleasant, neutral and unpleasant IAPS-pictures were presented (1 s) as a continuous random stream while high-density EEG and self-reported threat were assessed. In three experimental runs, each picture category was used once as a threat-cue, whereas in the other conditions the same category served as safety-cue. An additional passive viewing run served as a no-threat condition, thus, establishing a threat-safety continuum (threat-cue-safety-cue-no-threat) for each picture category. Threat-of-shock modulated P1, P2 and parieto-occipital LPP amplitudes. While the P1 component differentiated among threat- and no-threat conditions, the P2 and LPP effects were specific to pictures signaling threat-of-shock. Thus, stimulus processing progressively gained more accurate information about environmental threat conditions. Interestingly, the finding of increased EPN and centro-parietal LPP amplitudes to emotional pictures was independent from threat-of-shock manipulation. Accordingly, the results indicate distinct effects associated with the intrinsic significance of emotional pictures and explicitly instructed threat contingencies.


Figures

Fig. 1
Fig. 1
Illustration of the sensor montages of the high density EEG system (top view). Marked areas refer to sensor cluster (left and right) included in conventional ANOVA analyses regarding Threat Imminence and Picture Category ERP effects.
Fig. 2
Fig. 2
Illustration of the Threat Imminence effect as revealed by the P1 component. (A) ERP waveforms for an exemplary right parieto-occipital sensor (#141) and mean amplitudes (±s.e.m.) averaged over time interval (92–112 ms) and clusters (left, right) for threat-cue, safety-cue and no-threat conditions (*P < 0.05). (B) Topographical difference maps (threat-cue–no-threat, safety-cue–no-threat, threat-cue–safety-cue) displaying the averaged time interval (92–112 ms) plotted on a back view of a model head.
Fig. 3
Fig. 3
Illustration of the Threat Imminence effect as revealed by the P2 component. (A) ERP waveforms for an exemplary left central sensor (#45) and mean amplitudes (± s.e.m.) averaged over time interval (188–208 ms) and clusters (left, right) for threat-cue, safety-cue and no-threat conditions (**P < 0.01). (B) Topographical difference maps (threat-cue–no-threat, safety-cue–no-threat, threat-cue–safety-cue) displaying the averaged time interval (188–208 ms) plotted on a top view of a model head.
Fig. 4
Fig. 4
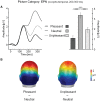
Illustration of the Picture Category effect as revealed by the EPN component. (A) ERP waveforms for an exemplary left occipito-temporal sensor (#113) and mean amplitudes (±s.e.m.) averaged over time interval (200–300 ms) and clusters (left, right) for pleasant, neutral, and unpleasant pictures (***P < 0.001). (B) Topographical difference maps (pleasant—neutral, unpleasant—neutral) displaying the averaged time interval (200–300 ms) plotted on a back view of a model head.
Fig. 5
Fig. 5
Illustration of the Picture Category effect as revealed by the centro-parietal LPP component. (A) ERP waveforms for an exemplary left centro-parietal sensor (#60) and mean amplitudes averaged (±s.e.m.) over time interval (400–600 ms) and clusters (left, right) for pleasant, neutral, and unpleasant pictures (**P < 0.01; ***P < 0.001). (B) Topographical difference maps (pleasant–neutral, unpleasant–neutral) displaying the averaged time interval (400–600 ms) plotted on a top view of a model head.
Fig. 6
Fig. 6
Illustration of the Threat Imminence effect as revealed by the parieto-occipital LPP component. (A) ERP waveforms for an exemplary left parieto-occipital sensor (#80) and mean amplitudes (± s.e.m.) averaged over time interval (496–724 ms) and clusters (left, right) for threat-cue, safety-cue and no-threat conditions (*P < 0.05; **P < 0.01). (B) Topographical difference maps (threat-cue–no-threat, safety-cue–no-threat, threat-cue–safety-cue) displaying the averaged time interval (496–724 ms) plotted on a back view of a model head.

References

    1. Baas JM, Kenemans JL, Böcker KB, Verbaten MN. Threat-induced cortical processing and startle potentiation. NeuroReport. 2002;13(1):133–7. - PubMed
    1. Böcker KB, Baas JM, Kenemans JL, Verbaten MN. Differences in startle modulation during instructed threat and selective attention. Biological Psychology. 2004;67(3):343–58. - PubMed
    1. Bradley MM. Emotion and motivation. In: Cacioppo JT, Tassinary LG, Berntson GG, editors. Handbook of Psychophysiology. New York: Cambridge University Press; 2000. pp. 602–42.
    1. Bradley MM. Natural selective attention: orienting and emotion. Psychophysiology. 2009;46:1–11. - PMC - PubMed
    1. Bradley MM, Codispoti M, Cuthbert BN, Lang PJ. Emotion and motivation I: defensive and appetitive reactions in picture processing. Emotion. 2001;1(3):276–98. - PubMed

Publication types