

Impairment of speech production predicted by lesion load of the left arcuate fasciculus
- PMID: 21719773
- PMCID: PMC3167233
- DOI: 10.1161/STROKEAHA.110.606103
Impairment of speech production predicted by lesion load of the left arcuate fasciculus
Abstract
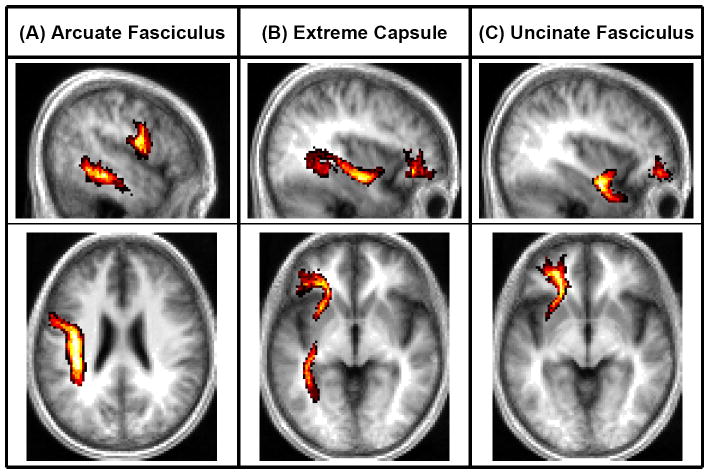
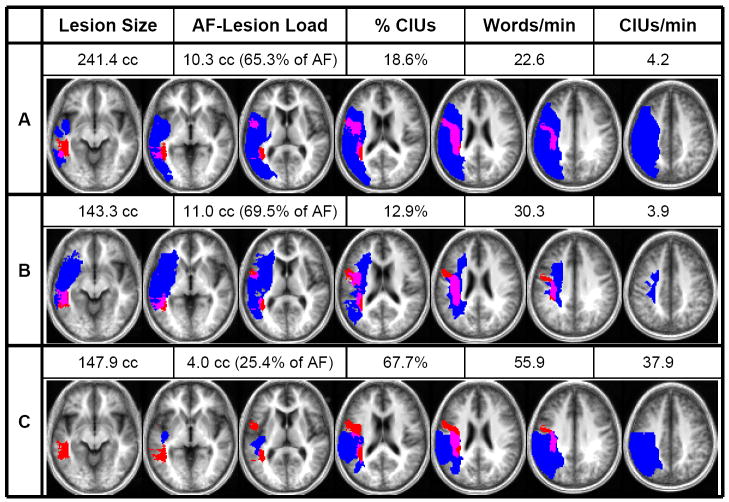
Background and purpose: Previous studies have suggested that patients' potential for poststroke language recovery is related to lesion size; however, lesion location may also be of importance, particularly when fiber tracts that are critical to the sensorimotor mapping of sounds for articulation (eg, the arcuate fasciculus) have been damaged. In this study, we tested the hypothesis that lesion loads of the arcuate fasciculus (ie, volume of arcuate fasciculus that is affected by a patient's lesion) and of 2 other tracts involved in language processing (the extreme capsule and the uncinate fasciculus) are inversely related to the severity of speech production impairments in patients with stroke with aphasia.
Methods: Thirty patients with chronic stroke with residual impairments in speech production underwent high-resolution anatomic MRI and a battery of cognitive and language tests. Impairment was assessed using 3 functional measures of spontaneous speech (eg, rate, informativeness, and overall efficiency) as well as naming ability. To quantitatively analyze the relationship between impairment scores and lesion load along the 3 fiber tracts, we calculated tract-lesion overlap volumes for each patient using probabilistic maps of the tracts derived from diffusion tensor images of 10 age-matched healthy subjects.
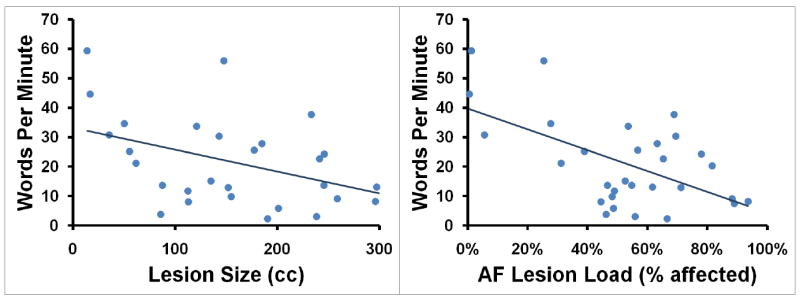
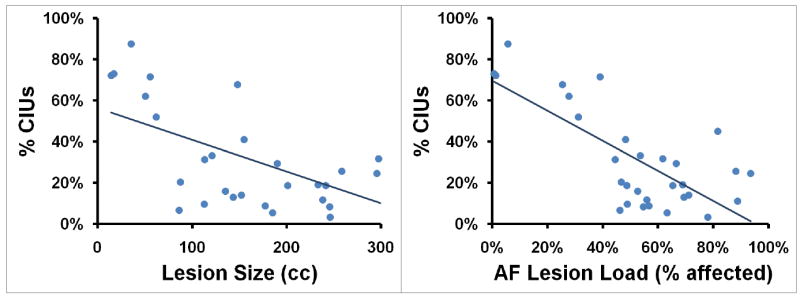
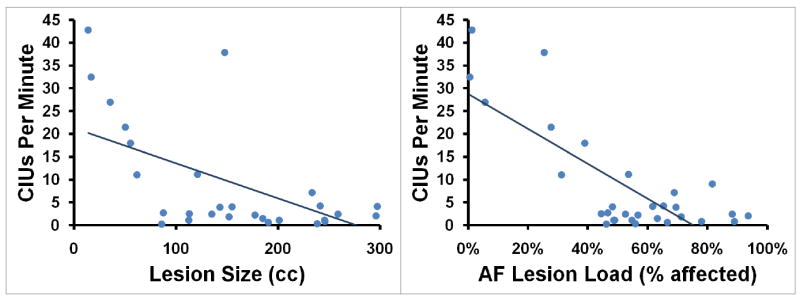
Results: Regression analyses showed that arcuate fasciculus lesion load, but not extreme capsule or uncinate fasciculus lesion load or overall lesion size, significantly predicted rate, informativeness, and overall efficiency of speech as well as naming ability.
Conclusions: A new variable, arcuate fasciculus lesion load, complements established voxel-based lesion mapping techniques and, in the future, may potentially be used to estimate impairment and recovery potential after stroke and refine inclusion criteria for experimental rehabilitation programs.
Conflict of interest statement
Figures
Similar articles
-
Anatomical predictors of aphasia recovery: a tractography study of bilateral perisylvian language networks.Brain. 2014 Jul;137(Pt 7):2027-39. doi: 10.1093/brain/awu113. Brain. 2014. PMID: 24951631
-
Clinical characteristics of post-stroke basal ganglia aphasia and the study of language-related white matter tracts based on diffusion spectrum imaging.Neuroimage. 2024 Jul 15;295:120664. doi: 10.1016/j.neuroimage.2024.120664. Epub 2024 May 31. Neuroimage. 2024. PMID: 38825217
-
Damage to the anterior arcuate fasciculus predicts non-fluent speech production in aphasia.Brain. 2013 Nov;136(Pt 11):3451-60. doi: 10.1093/brain/awt267. Epub 2013 Oct 15. Brain. 2013. PMID: 24131592 Free PMC article.
-
Diffusion tensor imaging magnetic resonance imaging (DTI-MRI) helps to tailor speech therapy: A case report with a short narrative review.NeuroRehabilitation. 2023;53(3):397-402. doi: 10.3233/NRE-230082. NeuroRehabilitation. 2023. PMID: 37638456 Review.
-
Using functional imaging to understand therapeutic effects in poststroke aphasia.Curr Opin Neurol. 2015 Aug;28(4):330-7. doi: 10.1097/WCO.0000000000000217. Curr Opin Neurol. 2015. PMID: 26110806 Review.
Cited by
-
Combined assessment of progressive apraxia of speech brain microstructure by diffusion tensor imaging tractography and multishell neurite orientation dispersion and density imaging.Brain Behav. 2024 Jan;14(1):e3346. doi: 10.1002/brb3.3346. Brain Behav. 2024. PMID: 38376044 Free PMC article.
-
The role of microstructural integrity of major language pathways in narrative speech in the first year after stroke.J Stroke Cerebrovasc Dis. 2020 Sep;29(9):105078. doi: 10.1016/j.jstrokecerebrovasdis.2020.105078. Epub 2020 Jun 29. J Stroke Cerebrovasc Dis. 2020. PMID: 32807476 Free PMC article.
-
Altered white matter connectivity in never-medicated patients with schizophrenia.Hum Brain Mapp. 2013 Sep;34(9):2353-65. doi: 10.1002/hbm.22075. Epub 2012 Mar 28. Hum Brain Mapp. 2013. PMID: 22461372 Free PMC article.
-
Right hemispheric structural connectivity and poststroke language recovery.Hum Brain Mapp. 2023 May;44(7):2897-2904. doi: 10.1002/hbm.26252. Epub 2023 Feb 28. Hum Brain Mapp. 2023. PMID: 36852658 Free PMC article.
-
Predictive role of subcomponents of the left arcuate fasciculus in prognosis of aphasia after stroke: A retrospective observational study.Medicine (Baltimore). 2019 Jun;98(23):e15775. doi: 10.1097/MD.0000000000015775. Medicine (Baltimore). 2019. PMID: 31169676 Free PMC article.
References
-
- Lazar R, Antoniello D. Variability in recovery from aphasia. Current Neurology and Neuroscience Reports. 2008;8:497–502. - PubMed
-
- Kertesz A, Harlock W, Coates R. Computer tomographic localization, lesion size, and prognosis in aphasia and nonverbal impairment. Brain Lang. 1979;8:34–50. - PubMed
-
- Pedersen PM, Jorgensen HS, Nakayama H, Raaschou HO, Olsen TS. Aphasia in acute stroke - incidence, determinants, and recovery. Ann Neurol. 1995;38:659–666. - PubMed
-
- Laska AC, Hellblom A, Murray V, Kahan T, Von Arbin M. Aphasia in acute stroke and relation to outcome. J Intern Med. 2001;249:413–422. - PubMed
-
- Lazar RM, Speizer AE, Festa JR, Krakauer JW, Marshall RS. Variability in language recovery after first-time stroke. J Neurol Neurosurg Psychiatry. 2008;79:530–534. - PubMed
Publication types
MeSH terms
Grants and funding
LinkOut - more resources
Full Text Sources
Medical
