. 2011 Oct;10(10):M111.007930.
doi: 10.1074/mcp.M111.007930. Epub 2011 Jun 30.

Physiological response to membrane protein overexpression in E. coli

Affiliations

Physiological response to membrane protein overexpression in E. coli

Francesca Gubellini et al. Mol Cell Proteomics. 2011 Oct.

Abstract

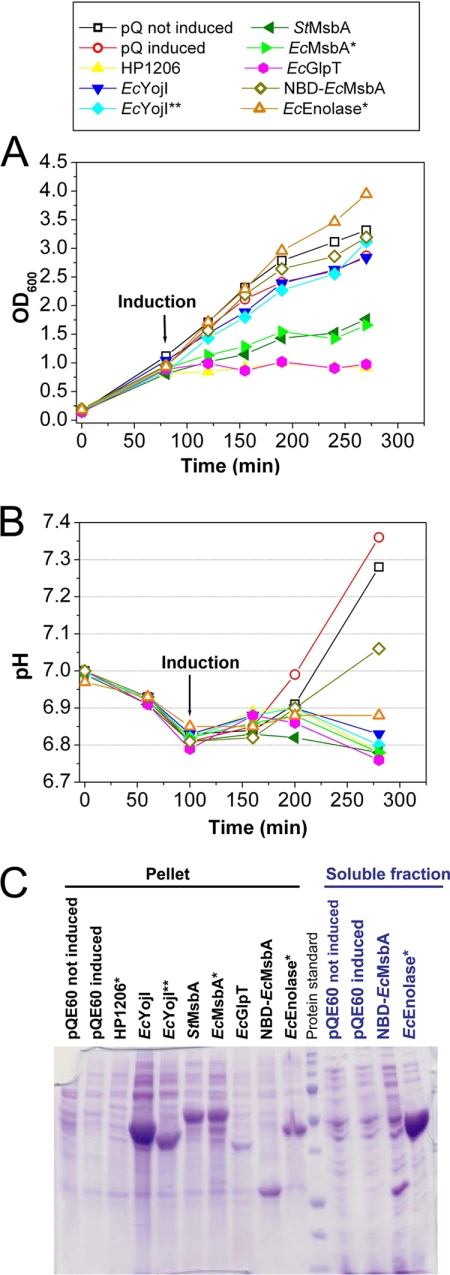
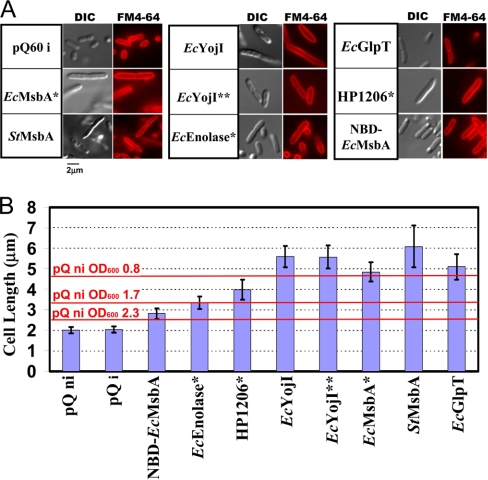
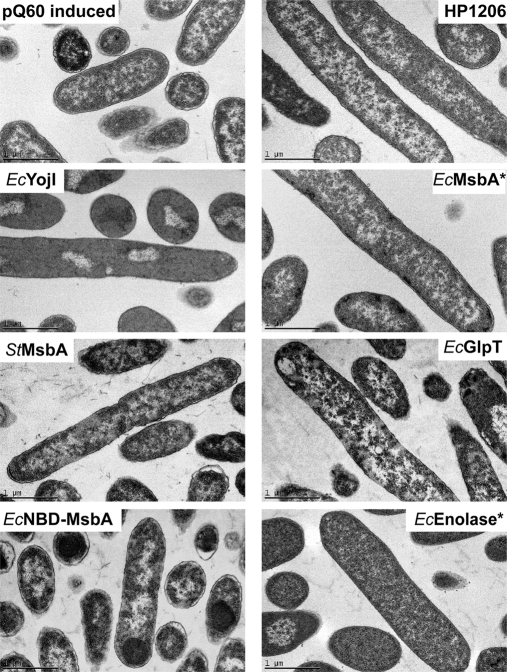
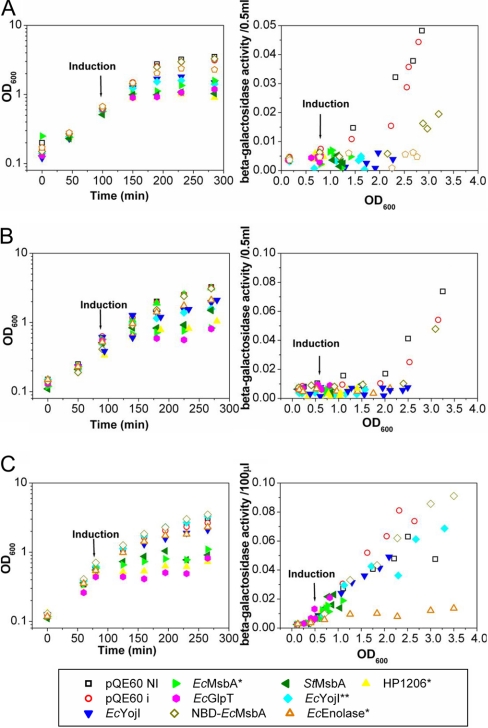
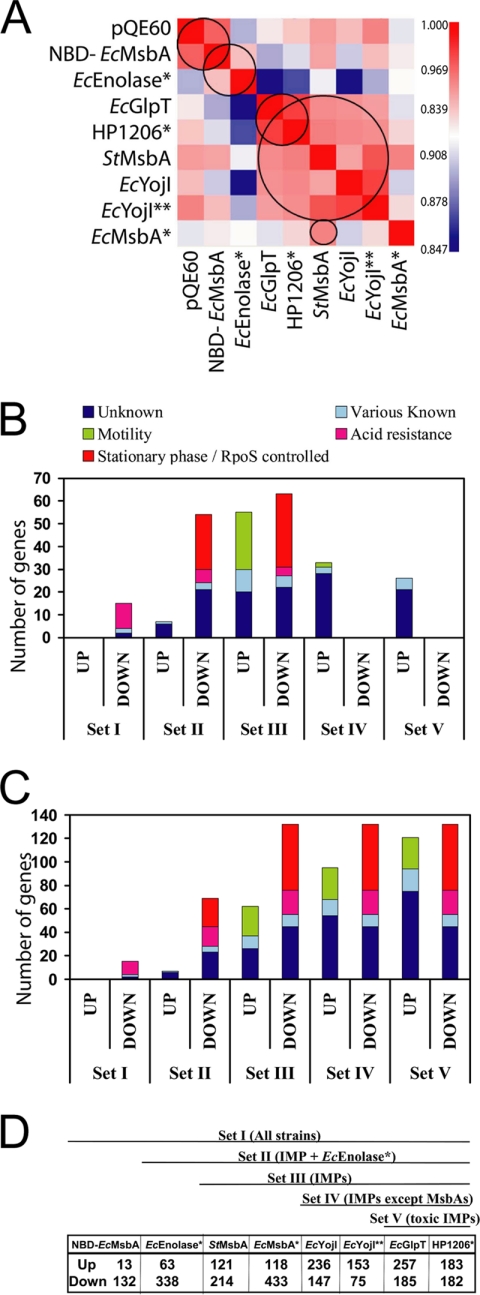
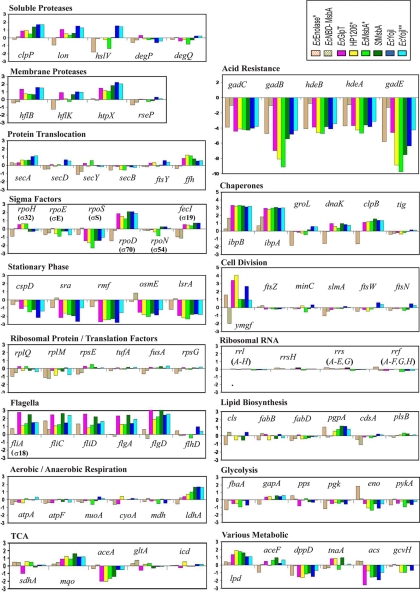
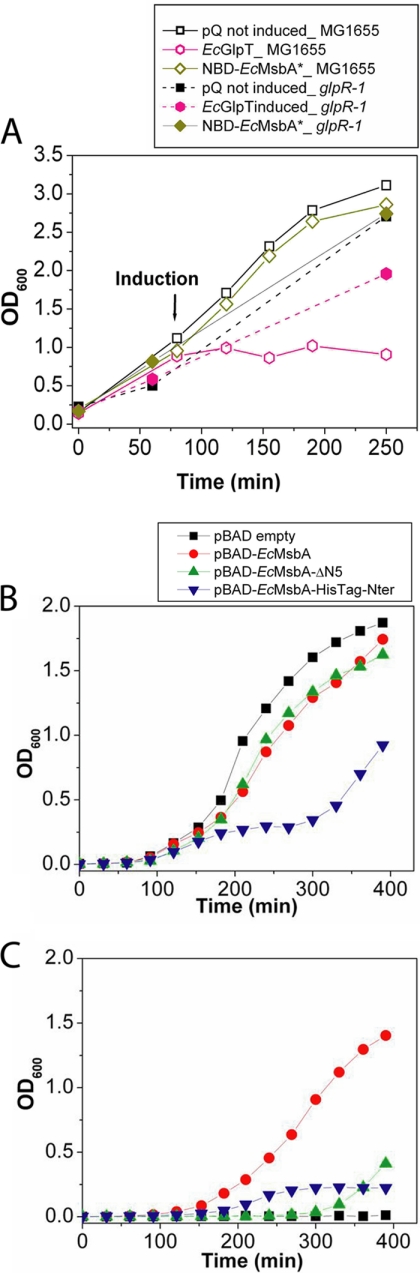
Overexpression represents a principal bottleneck in structural and functional studies of integral membrane proteins (IMPs). Although E. coli remains the leading organism for convenient and economical protein overexpression, many IMPs exhibit toxicity on induction in this host and give low yields of properly folded protein. Different mechanisms related to membrane biogenesis and IMP folding have been proposed to contribute to these problems, but there is limited understanding of the physical and physiological constraints on IMP overexpression and folding in vivo. Therefore, we used a variety of genetic, genomic, and microscopy techniques to characterize the physiological responses of Escherichia coli MG1655 cells to overexpression of a set of soluble proteins and IMPs, including constructs exhibiting different levels of toxicity and producing different levels of properly folded versus misfolded product on induction. Genetic marker studies coupled with transcriptomic results indicate only minor perturbations in many of the physiological systems implicated in previous studies of IMP biogenesis. Overexpression of either IMPs or soluble proteins tends to block execution of the standard stationary-phase transcriptional program, although these effects are consistently stronger for the IMPs included in our study. However, these perturbations are not an impediment to successful protein overexpression. We present evidence that, at least for the target proteins included in our study, there is no inherent obstacle to IMP overexpression in E. coli at moderate levels suitable for structural studies and that the biochemical and conformational properties of the proteins themselves are the major obstacles to success. Toxicity associated with target protein activity produces selective pressure leading to preferential growth of cells harboring expression-reducing and inactivating mutations, which can produce chemical heterogeneity in the target protein population, potentially contributing to the difficulties encountered in IMP crystallization.


Figures

Fig. 1.
Fig. 1.
Influence of protein overexpression on cell growth and culture pH. A, Growth curves in LB medium at 37 °C. E. coli MG1655 cells harboring the indicated pQE-derived expression vector and the pREP4 LacI-expressing plasmid were induced with 1 mm IPTG at an OD600 of 0.4–0.6, and growth was continued for 3 h. Measurements were conducted on culture aliquots diluted with LB to OD600 < 1.0. Two control cultures harboring the empty pQE-60 vector were evaluated, one induced with IPTG and the other not induced. B, Culture pH was measured using a standard electrode at the indicated times. C, Coomassie-Blue-stained 15% SDS-PAGE gel of cellular fractions at the end of the induction period. After lysis by sonication with a microtip probe, the extract was centrifuged for 1 h at 14,000 rpm to separate pellet and soluble fractions.
Fig. 2.
Fig. 2.
Cellular morphology analyzed by visible microscopy. A, At the end of the 3-hour induction period, cells were fixed with formaldehyde and treated with the fluorescent dye FM4–64, which stains the outer membrane. Differential interference contrast (DIC) and FM4–64 fluorescence images are shown for the same field-of-view containing both dividing and nondividing cells. B, Mean cell length in each culture, with error bars representing the standard deviation. The double asterisks (**) indicate a probability of less than 0.0001 that the distribution is the same as that in the control cells, according to the Student t test (n > 50). Red lines show the mean length of uninduced empty-vector control cells at the indicated OD600 (supplemental Fig. S5); induced cells gave equivalent results (data not shown).
Fig. 3.
Fig. 3.
Cellular morphology analyzed by thin-section electron microscopy. At the end of the 3-h induction period, cells were fixed, embedded, sectioned, stained with uranyl acetate, and imaged at 31,000 × magnification using a Philips CM12 microscope. The scale bar represents 1 μm. The cells exhibiting the highest cytosolic electron density contain the greatest amount of the overexpressed target proteins (EcEnolase* and EcYojI) based on Coomassie-Blue-stained SDS-PAGE analysis (Fig. 1C). Inner-membrane invaginations were not observed in any sample.
Fig. 4.
Fig. 4.
Reporter-gene assays of the activity of selected stress-response regulators. Cell growth was monitored via OD600 (left) in parallel with β-galactosidase reporter-gene activity (right) in MG1655-derived E. coli strains harboring a pQE-derived expression plasmid together with the pREP4 accessory plasmid. Expression of the target protein was induced with 1 mm IPTG at an OD600 of 0.4–0.6. The β-galactosidase reporter gene is fused to the σE-dependent promoter for the rpoH gene in strain SEA001 (A), to the CpxR-dependent promoter for the cpxP gene in strain SEA3122 (B), or to the σH-dependent promoter for the htpG gene in strain SEA3084 (C). Reporter-gene activity is displayed as a differential rate plot (29) showing β-galactosidase activity as a function of culture density (i.e. OD600).
Fig. 5.
Fig. 5.
Transcriptional microarray analyses. At the end of the 3-h induction period, RNA was isolated, reverse-transcribed, and the resulting fluorescent cDNA pools were hybridized to E. coli 2.0 microarray chips (Affymetrix Inc., Santa Clara, CA). Data were scaled using the RMA algorithm in the Affymetrix Expression Console (producing the values given in the supplemental data file entitled GubelliniMicroarrayDataMCP.xls). A, Heat map of Spearman rank correlation coefficients of the scaled expression levels observed in all pairs of arrays. Red and blue indicate the highest and lowest correlations, respectively. Five strongly correlated expression profiles were identified, as indicated by the black circles: IPTG-induced empty pQE-60 vector and overexpressed NBD-EcMsbA; overexpressed soluble proteins; strongly toxic IMPs; all IMPs except EcMsbA*; and EcMsbA* and StMsbA. (B–D) Incremental (B) and cumulative (C) counts of transcripts with significantly changed expression levels in progressively more restricted sets of protein-overexpressing cells (proceeding from left to right), colored according to membership in the functional categories indicated on the plot. The cumulative number of changes for each set (C) is equal to the sum of the incremental changes (B) in that set and all sets further to the left. A threefold change in expression level (i.e. a 1.58 increment in log2) relative to the IPTG-induced empty-vector control was used as the threshold for significance, although transcripts with greater than twofold changes were included in the counts if the majority of the samples in the corresponding of IPMs exceeded the threefold threshold. The schematic diagram at the bottom (D) defines the samples included in each of the five progressively restricted sets; the most inclusive (Set I) contains all overexpressing cells, whereas the most restricted (Set V) contains only the cells expressing the two strongly toxic IMPs (EcGlpT and HP1206*). A list of the genes included in each set is given in supplemental Table S2.
Fig. 6.
Fig. 6.
Expression changes in representative genes in various physiological systems. Changes are specified as log2 of the ratio of the transcript level in cells overexpressing the indicated protein to that in the IPTG-induced empty-vector control. Note that the scale on the ordinate is identical in all of the plots (i.e., the increment in log2 per unit of length on the page).
Fig. 7.
Fig. 7.
Toxicity is controlled by the biochemical and biophysical properties of the target IMP. A, OD600 was used to monitor cell growth during induction of expression of EcGlpT or NBD-EcMsbA in E. coli MG1655 cells without (empty symbols) or with (filled symbols) the glpR-1 mutation that produces constitutive expression of the enzymes mediating glycerol degradation. These experiments employed the same pQE-derived expression vectors used in Fig. 1 and elsewhere in this paper. B, Cell growth was monitored during induction of several different EcMsbA constructs from arabinose-controlled pBAD plasmids in E. coli W3110A cells: pBAD-EcMsbA expresses the full-length protein (red); pBAD-EcMsbA-ΔN5 expresses the ΔN5 construct which is missing residues 2–5 and equivalent to the EcMsbA* construct in the pQE60 vector (green); and EcMsbA-HisTag-Nter expresses the full-length protein with an N-terminal hexahistidine tag (blue). Induction was carried out at 42 °C in presence of 0.02% arabinose. C, Growth of E. coli strain WD2S containing the indicated pBAD expression plasmid at 42 °C, the nonpermissive temperature for the temperature-sensitive mutation in the chromosomally encoded msbA gene in this derivative of strain W3110A. For the experiments in panels B and C, the growth medium contained 0.02% arabinose to induce MsbA construct expression starting at zero time.

Similar articles

Cited by

References

    1. Gordon E., Horsefield R., Swarts H. G., de Pont J. J., Neutze R., Snijder A. (2008) Effective high-throughput overproduction of membrane proteins in Escherichia coli. Protein Expr. Purif. 62, 1–8 - PubMed
    1. Wagner S., Baars L., Ytterberg A. J., Klussmeier A., Wagner C. S., Nord O., Nygren P. A., van Wijk K. J., de Gier J. W. (2007) Consequences of membrane protein overexpression in Escherichia coli. Mol. Cell Proteomics 6, 1527–1550 - PubMed
    1. Wagner S., Klepsch M. M., Schlegel S., Appel A., Draheim R., Tarry M., Högbom M., van Wijk K. J., Slotboom D. J., Persson J. O., de Gier J. W. (2008) Tuning Escherichia coli for membrane protein overexpression. Proc. Natl. Acad. Sci. U.S.A. 105, 14371–14376 - PMC - PubMed
    1. Wang D. N., Safferling M., Lemieux M. J., Griffith H., Chen Y., Li X. D. (2003) Practical aspects of overexpressing bacterial secondary membrane transporters for structural studies. Biochim. Biophys. Acta 1610, 23–36 - PubMed
    1. White S. H. (2009) Biophysical dissection of membrane proteins. Nature 459, 344–346 - PubMed

Publication types

MeSH terms

LinkOut - more resources