. 2011;34(2):115-25.
doi: 10.1159/000329327. Epub 2011 Jun 29.

Angiotensin II activation of mTOR results in tubulointerstitial fibrosis through loss of N-cadherin

Affiliations

Angiotensin II activation of mTOR results in tubulointerstitial fibrosis through loss of N-cadherin

Adam Whaley-Connell et al. Am J Nephrol. 2011.

Abstract

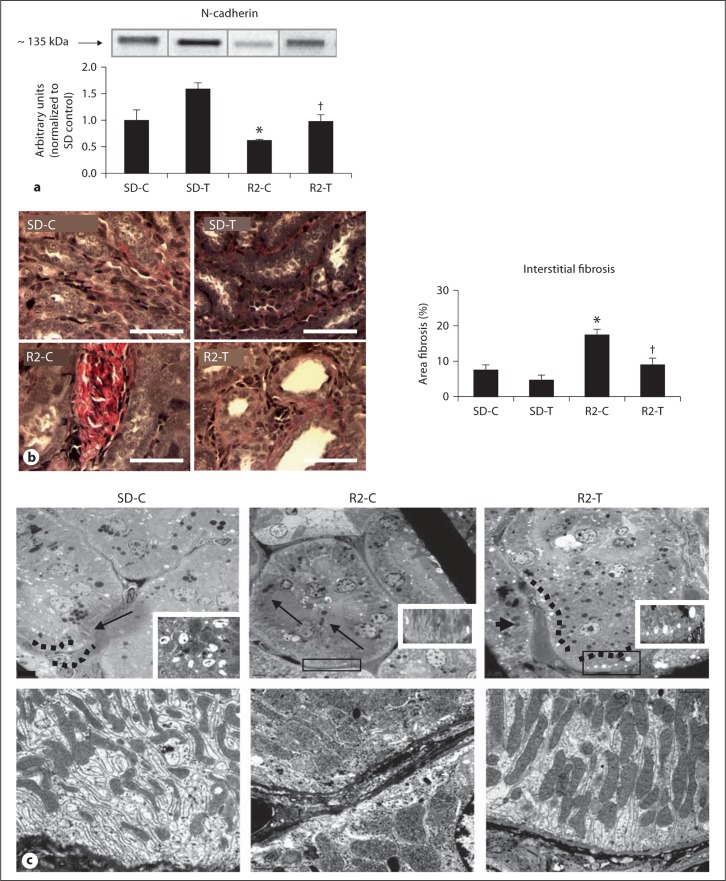
Background/aims: Angiotensin (Ang) II contributes to tubulointerstitial fibrosis. Recent data highlight mammalian target of rapamycin (mTOR)/S6 kinase 1 (S6K1) signaling in tubulointerstitial fibrosis; however, the mechanisms remain unclear. Thereby, we investigated the role of Ang II on mTOR/S6K1-dependent proximal tubule (PT) injury, remodeling, and fibrosis.

Methods: We utilized young transgenic Ren2 rats (R2-T) and Sprague-Dawley rats (SD-T) treated with the Ang type 1 receptor (AT(1)R) blocker telmisartan (2 mg · kg(-1) · day(-1)) or vehicle (R2-C; SD-C) for 3 weeks to examine PT structure and function.

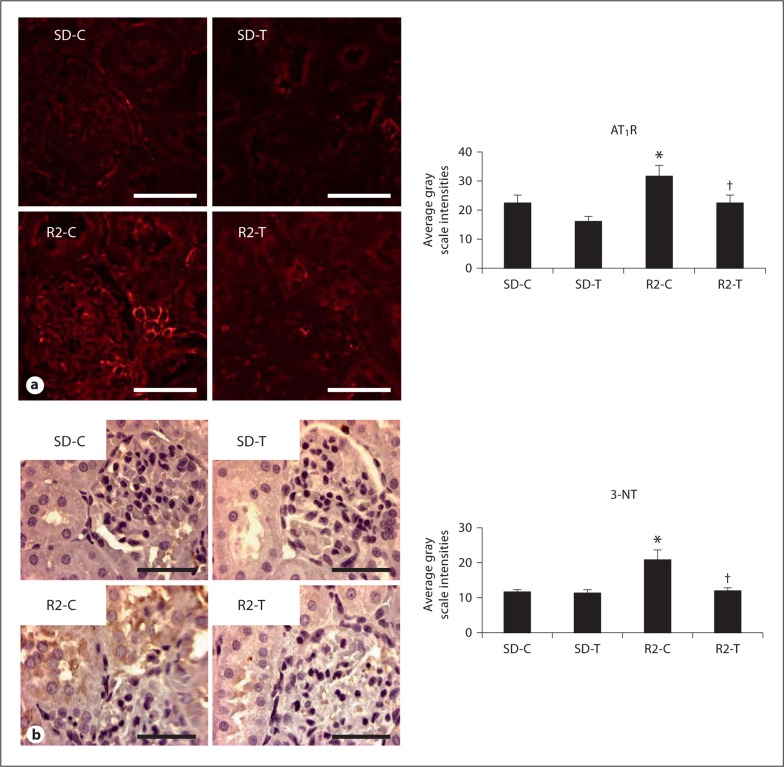
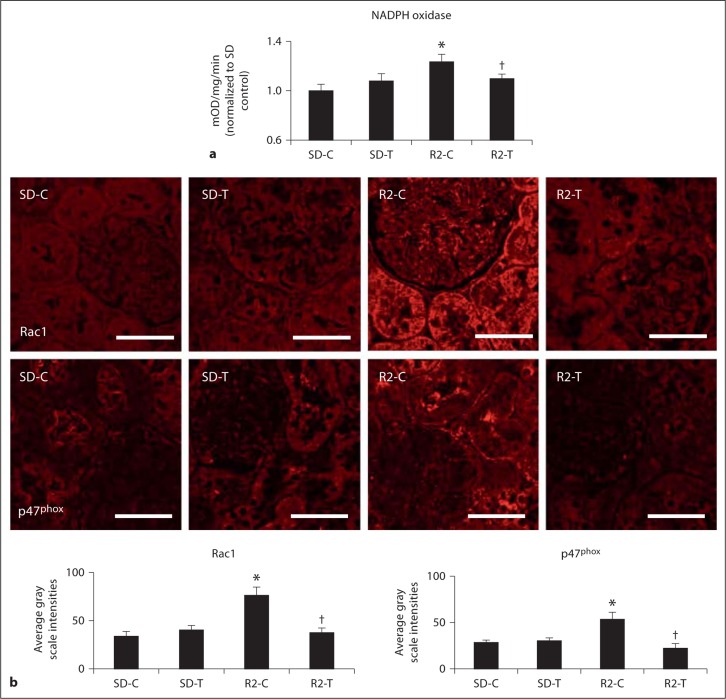
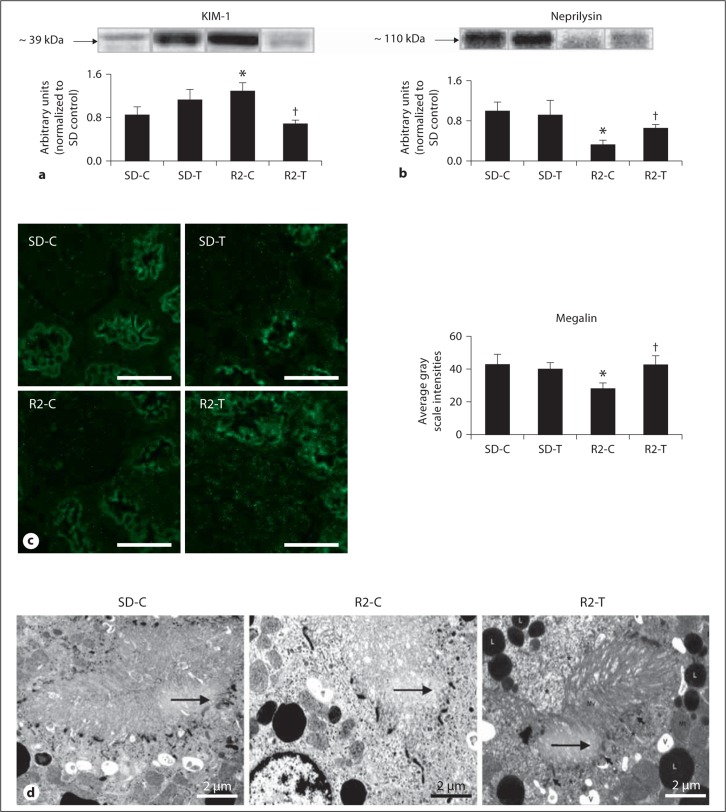
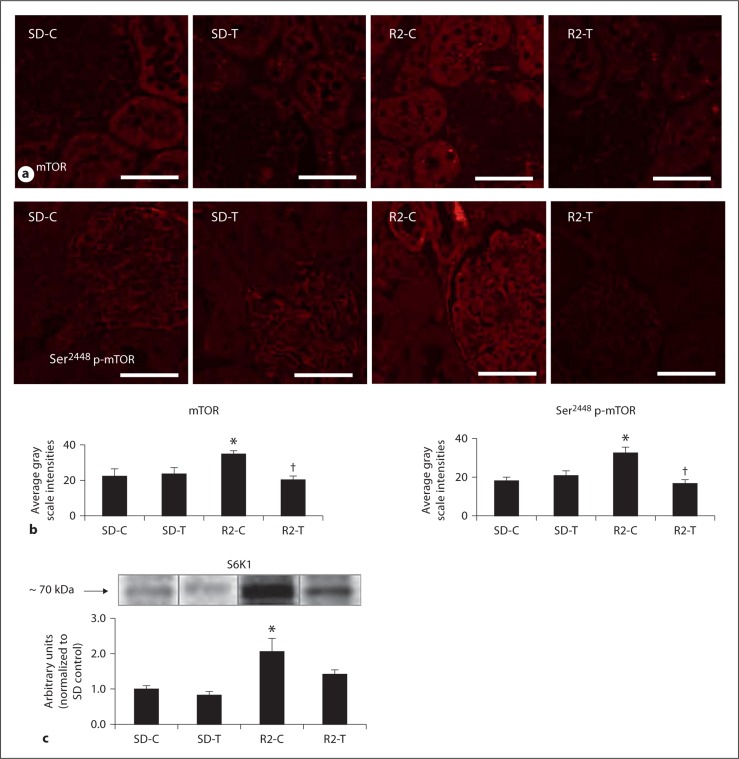
Results: Ren2 rats displayed increased systolic blood pressure, proteinuria and increased PT oxidant stress and remodeling. There were parallel increases in kidney injury molecule-1 and reductions in neprilysin and megalin with associated ultrastructural findings of decreased clathrin-coated pits, endosomes, and vacuoles. Ren2 rats displayed increased Serine(2448) phosphorylation of mTOR and downstream S6K1, in concert with ultrastructural basement membrane thickening, tubulointerstitial fibrosis and loss of the adhesion molecule N-cadherin. Telmisartan treatment attenuated proteinuria as well as the biochemical and tubulointerstitial structural abnormalities seen in the Ren2 rats.

Conclusions: Our observations suggest that Ang II activation of the AT(1)R contributes to PT brush border injury and remodeling, in part, due to enhanced mTOR/S6K1 signaling which promotes tubulointerstitial fibrosis through loss of N-cadherin.


Figures

Fig. 1
Fig. 1
Angiotensin II contributes to PTC oxidative stress through activation of the AT1R. a Representative images of semi-quantitative immunohistochemical analysis and localization of the AT1R to the PT with corresponding measures to the right. b Representative images of PT 3-NT content, a marker of peroxynitrite formation (ONOO), with corresponding measures to the right. * p < 0.05 when compared to age-matched Sprague-Dawley controls (SD-C); p < 0.05 when telmisartan-treated R2 rats (R2-T) are compared to age-matched Ren2 controls (R2-C). Scale bar = 50 μm.
Fig. 2
Fig. 2
Angiotensin II activation of PTC NADPH oxidase. a Total NADPH oxidase activity. b Depicts representative images of semi-quantitative immunohistochemistry analysis and localization of NADPH oxidase subunits Rac1 and p47phox to the PT with corresponding measures of intensity below. * p < 0.05 when compared to age-matched Sprague-Dawley controls (SD-C); p < 0.05 when telmisartan-treated R2 rats (R2-T) are compared to age-matched Ren2 controls (R2-C). Scale bar = 50 μm.
Fig. 3
Fig. 3
Angiotensin II contributes to PTC brush border injury. Western blot analysis: a KIM-1, a type 1 membrane protein localized to PT epithelial cells expressed at high levels in human and rodent kidneys after injury, and b neprilysin (e.g. neutral endopeptidase), a PT brush border enzyme responsible for processing filtered peptides and cleaved during PT injury. c Representative images from semi-quantitative immunohistochemistry analysis of PT-specific megalin with corresponding measures of intensities to the right. Scale bar = 50 μm. * p < 0.05 when compared to age-matched Sprague-Dawley controls (SD-C); p < 0.05 when telmisartan-treated R2 rats (R2-T) are compared to age-matched Ren2 controls (R2-C). d Ultrastructural analysis of the PTC with TEM. Representative images depict the endosomal region of the Ren2 control (R2-C) model (middle panel), that demonstrates decreased clathrin-coated pits, endosomes, and apical vacuoles (arrows) compared to the SD-C models (left panel): note that telmisartan treatment in the R2 (R2-T; right panel) restores the alterations compared to the R2-C.
Fig. 4
Fig. 4
Angiotensin II contributes to activation of PTC mTOR signaling. a,b Representative images from semi-quantitative immunohistochemistry analysis and localization of PT mTOR and Ser2448 p-mTOR with corresponding intensities below. Scale bar = 50 μm. c Western blot analysis of S6K1 the main effector peptide of mTOR. * p < 0.05 when compared to age-matched Sprague-Dawley controls (SD-C); p < 0.05 when telmisartan-treated R2 rats (R2-T) are compared to age-matched Ren2 controls (R2-C).
Fig. 5
Fig. 5
Angiotensin II contributes to loss of PT N-cadherin, basolateral remodeling and tubulointerstitial fibrosis. a Western blot analysis ofthe PT-specific adhesion molecule N-cadherin. b Verhoeff-Van Gieson (VVG) stain for elastin and collagen with measures of tubulointerstitial fibrosis to the right. Scale bar 50 μm. * p < 0.05 when compared to age-matched Sprague-Dawley controls (SD-C); p < 0.05 when telmisartan-treated R2 rats (R2-T) are compared to age-matched Ren2 controls (R2-C). c Representative images from ultrastructural analysis of TEM for the S-1 region of the PT. Top panel depicts lysosomes in the basal region of the PT wherein there is loss of electron dense lysosome (arrows) in the R2-C model (middle panel) compared to age-matched SD-C, restored with telmisartan treatment in the Ren2. Bottom panel depicts elongated canalicular plasma membrane infoldings, loss of basal polarity, elongated mitochondriaand basement membrane thickening in the basal region of the R2-C compared to SD-C, findings improved in the telmisartan-treated R2 model.

Similar articles

Cited by

References

    1. Eddy AA. Progression in chronic kidney disease. Adv Chronic Kidney Dis. 2005;12:353–365. - PubMed
    1. Rodríguez-Iturbe B, García García G. The role of tubulointerstitial inflammation in the progression of chronic renal failure. Nephron Clin Pract. 2010;116:c81–c88. - PubMed
    1. Fujii H, Kono K, Nakai K, Goto S, Komaba H, Hamada Y, Shinohara M, Kitazawa R, Kitazawa S, Fukagawa M. Oxidative and nitrosative stress and progression of diabetic nephropathy in type 2 diabetes. Am J Nephrol. 2010;31:342–352. - PubMed
    1. Okada H, Kalluri R. Cellular and molecular pathways that lead to progression and regression of renal fibrogenesis. Curr Mol Med. 2005;5:467–474. - PubMed
    1. Sowers JR. Metabolic risk factors and renal disease. Kidney Int. 2007;71:719–720. - PubMed

Publication types