. 2011 Jun 16:5:46.
doi: 10.3389/fnsys.2011.00046. eCollection 2011.

Altered Balance of Activity in the Striatal Direct and Indirect Pathways in Mouse Models of Huntington's Disease

Affiliations

Altered Balance of Activity in the Striatal Direct and Indirect Pathways in Mouse Models of Huntington's Disease

Véronique M André et al. Front Syst Neurosci. .

Abstract

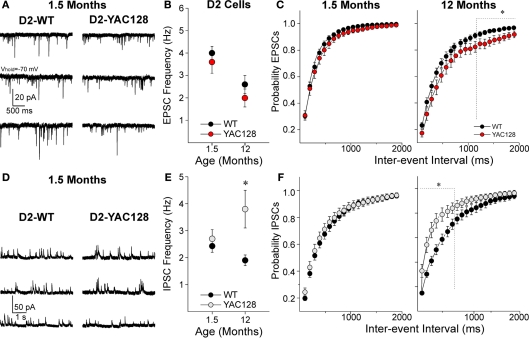
Imbalance in the activity of striatal direct and indirect pathway neurons contributes to motor disturbances in several neurodegenerative diseases. In Huntington's disease (HD), indirect pathway [dopamine (DA) D2 receptor-expressing] medium-sized spiny neurons (MSNs) are believed to show earlier vulnerability than direct pathway MSNs. We examined synaptic activity and DA modulation in MSNs forming the direct and indirect pathways in YAC128 and BACHD mouse models of HD. To visualize the two types of MSNs, we used mice expressing enhanced green fluorescent protein under the control of the promoter for the DA D1 or D2 receptor. Experiments were performed in early symptomatic (1.5 months) and symptomatic (12 months) mice. Behaviorally, early symptomatic mice showed increased stereotypies while symptomatic mice showed decreased motor activity. Electrophysiologically, at the early stage, excitatory and inhibitory transmission onto D1-YAC128 and D1-BACHD MSNs were increased, while there was no change in D2 MSNs. DA modulation of spontaneous excitatory postsynaptic currents (sEPSCs) in slices was absent in YAC128 cells at the early stage, but was restored by treating the slices with the DA depleter tetrabenazine (TBZ). In BACHD mice TBZ restored paired-pulse ratios and a D1 receptor antagonist induced a larger decrease of sEPSCs than in D1-WT cells, suggesting increased DA tone. Finally, TBZ decreased stereotypies in BACHD mice. These results indicate that by reducing DA or antagonizing D1 receptors, increases in inhibitory and excitatory transmission in early phenotypic direct pathway neurons can be normalized. In symptomatic YAC128 mice, excitatory synaptic transmission onto D1 MSNs was decreased, while inhibitory transmission was increased in D2 MSNs. These studies provide evidence for differential and complex imbalances in glutamate and GABA transmission, as well as in DA modulation, in direct and indirect pathway MSNs during HD progression.

Keywords: GABA; Huntington's disease; dopamine; electrophysiology; glutamate; postsynaptic currents; synaptic activity.


Figures

Figure 1
Figure 1
Alterations in excitatory and inhibitory transmission in D1-YAC128 cells. (A) Traces show sEPSCs in the presence of Bic in D1 cells from 1.5-month-old WT (left) and YAC128 (right) mice. (B) Graph shows that at 1.5 months, mean sEPSC frequency is higher in D1-YAC128 cells (n = 9) compared to D1-WT (n = 31) while at 12 months, it is lower in D1-YAC128 cells (n = 15) than in D1-WT cells (n = 16). (C) There was a leftward shift in the cumulative probability distribution of inter-event intervals for sEPSCs in D1-YAC128 cells at 1.5 months, while at 12 months there was a rightward shift D1-YAC128 cells. (D) Traces show sIPSCs in D1 cells from 1.5-month-old WT (left) and YAC128 (right) mice. (E) Graph shows that mean sIPSC frequency at 1.5 months is higher in D1-YAC128 (n = 20) than in D1-WT (n = 31) while at 12 months, it is similar in D1-WT (n = 17) and D1-YAC128 cells (n = 14). (F) There was a leftward shift in the cumulative probability distribution of inter-event intervals for sIPSCs at 1.5 months, while at 12 months the distributions of sIPSC are similar. *, **: significant difference between WT and YAC128 cells.
Figure 2
Figure 2
Alterations in excitatory and inhibitory transmission in D2-YAC128 cells. (A) Traces show sEPSCs in D2 cells from 1.5-month-old WT (left) and YAC128 (right) mice. (B) Graph shows there are no significant differences in mean EPSC frequency between D2-YAC128 (n = 25 at 1.5 and n = 13 at 12 months) and D2-WT (n = 14 at 1.5 and n = 20 at 12 months) cells at any age. (C) Cumulative probability distributions of inter-event interval histograms for sEPSCs show that D2-WT and D2-YAC128 cells display similar distributions at 1.5 months, while at 12 months D2-YAC128 cells display significantly fewer events at the longer intervals only. (D) Traces show sIPSCs in D2 cells from 1.5-month-old WT (left) and YAC128 (right) mice. (E) Graph shows that mean sIPSC frequency in D2 cells is similar in D2-WT (n = 26) and D2-YAC128 cells (n = 16) at 1.5 months while at 12 months, IPSC frequency is higher in D2-YAC128 (n = 14) than in D2-WT cells (n = 15). (F) Cumulative probability distributions of inter-event intervals for sIPSCs show that D2-YAC128 cells display more events at 12 months but not at 1.5 months. *: significant difference between WT and YAC128 cells.
Figure 3
Figure 3
Glutamate and GABA transmission in BACHD mice at 2 months. (A) Mean sEPSC frequency is increased in D1-BACHD cells (n = 11) compared to D1-WT cells (n = 9). (B) Traces of two evoked glutamate responses at 25 ms interval. (C) PPRs were significantly decreased in D1-BACHD cells (n = 10) compared to D1-WT cells (n = 8) at 2 months (25, 50, and 100 ms intervals), indicating increased probability of glutamate release. In D2 cells, PPRs were similar in WT (n = 11) and BACHD mice (n = 6). (D,E) Cumulative probability distributions of inter-event intervals for sIPSCs show that D1-BACHD (n = 14) cells display more events at shorter intervals than D1-WT cells (n = 11) at 1.5 months, while D2 cells show no differences in sIPSC distribution (WT, n = 6; BACHD, n = 6). Insets in (D,E) show mean sIPSC frequencies *: significant difference between WT and BACHD.
Figure 4
Figure 4
D1 and D2 receptor modulation in acutely dissociated MSNs is similar in WT and YAC128 cells at 1. 5 months. (A) Examples of acutely dissociated MSNs in WT and YAC128. (B) Traces of NMDA currents (100 μM) in D1 cells show the D1 agonist SKF81297 (1 μM) increases the amplitude of NMDA currents in D1-WT (n = 9) and D1-YAC128 cells (n = 10). Graph shows the percent potentiation by SKF81297 is similar in D1-WT and D1-YAC128 cells. (C) Traces of NMDA currents (100 μM) in D2 cells show the D2 agonist quinpirole (10 μM) decreases NMDA currents in D2-WT (n = 5) and D2-YAC128 cells (n = 5). Graph shows the percent attenuation by quinpirole is similar in D2-WT and D2-YAC128 cells.
Figure 5
Figure 5
Alterations in DA modulation in early HD. (A) Traces of sEPSCs in a D1-WT MSN (left), a D1-YAC128 MSN (middle) and a TBZ-treated D1-YAC128 MSN before and after application of the D1 agonist SKF81297 at 1.5 months. (B) Bar graph shows that the D1 agonist increased sEPSC frequency in D1-WT cells (n = 12) while it had no effect in D1-YAC128 cells (n = 10). The D1 agonist effect on sEPSC frequency was restored by TBZ treatment in D1-YAC128 cells (n = 8). (C) Top panel shows traces of paired-pulse evoked glutamate currents in D1-BACHD cells at 2 months. Bottom panel graph shows the decrease in PPRs in DMSO-treated D1-BACHD cells (n = 17) is increased in TBZ-treated D1-BACHD cells (n = 8). (D) Amplitude–frequency histogram shows that in D1-WT cells, the D1 antagonist SCH23390 (20 μM) had no effect on sEPSC frequency. In contrast, in D1-BACHD cells (2 months), the D1 antagonist decreased sEPSC frequency. Inset shows that the percent change induced by SCH23390 is significantly different in D1-WT (n = 9) and D1-BACHD cells (n = 11). (E) Amplitude–frequency histogram shows that in D1-WT cells (n = 8), the D1 antagonist SCH23390 (10 μM) did not significantly decrease the frequency of sIPSCs. In D1-BACHD cells (n = 6), the D1 antagonist decreased the frequency of sIPSCs. Inset shows that although the percent change induced by SCH23390 tended to be higher in D1-BACHD cells, it was not significantly different from that in D1-WT cells. *p < 0.05, **p < 0.01, effect of TBZ or SCH23390 compared to control; #p < 0.05 and ###p < 0.001, difference between WT and YAC128 or BACHD cells.
Figure 6
Figure 6
Representation of glutamate, GABA, and DA projections onto direct (D1) and indirect pathway (D2) MSNs in HD. In WT (left), DA released by nigrostriatal inputs activates glutamate and GABA release onto D1 MSNs while it decreases glutamate and GABA release onto D2 MSNs. In early HD (middle), increased DA transmission leads to increased release of glutamate and GABA onto D1 MSNs. There is no change onto D2 MSNs, suggesting changes in indirect pathway MSNs might occur at a different time point or involve other mechanisms. In late HD (right), D1 MSNs display decreases in glutamate transmission, presumably due to loss of corticostriatal inputs and/or decreased DA transmission. In contrast, D2 MSNs display only a small decrease in glutamate synaptic inputs while GABA synaptic transmission is increased, probably through altered D2 receptor function.

References

    1. Albin R. L., Reiner A., Anderson K. D., Penney J. B., Young A. B. (1990). Striatal and nigral neuron subpopulations in rigid Huntington's disease: implications for the functional anatomy of chorea and rigidity-akinesia. Ann. Neurol. 27, 357–365 - PubMed
    1. André V. M., Cepeda C., Cummings D. M., Jocoy E. L., Fisher Y. E., Yang X. W., Levine M. S. (2010). Dopamine modulation of excitatory currents in the striatum is dictated by the expression of D1 or D2 receptors and modified by endocannabinoids. Eur. J. Neurosci. 31, 14–28 - PubMed
    1. André V. M., Cepeda C., Fisher Y. E., Huynh M., Bardakjian N., Singh S., Yang X. W., Levine M. S. (2011). Differential electrophysiological changes in striatal output neurons in Huntington's disease. J. Neurosci. 31, 1170–118210.1523/JNEUROSCI.3539-10.2011 - DOI - PMC - PubMed
    1. Bamford N. S., Robinson S., Palmiter R. D., Joyce J. A., Moore C., Meshul C. K. (2004). Dopamine modulates release from corticostriatal terminals. J. Neurosci. 24, 9541–955210.1523/JNEUROSCI.2891-04.2004 - DOI - PMC - PubMed
    1. Benn C. L., Slow E. J., Farrell L. A., Graham R., Deng Y., Hayden M. R., Cha J. H. (2007). Glutamate receptor abnormalities in the YAC128 transgenic mouse model of Huntington's disease. Neuroscience 147, 354–372 - PMC - PubMed

LinkOut - more resources