

Statistical analyses support power law distributions found in neuronal avalanches
- PMID: 21720544
- PMCID: PMC3102672
- DOI: 10.1371/journal.pone.0019779
Statistical analyses support power law distributions found in neuronal avalanches
Abstract
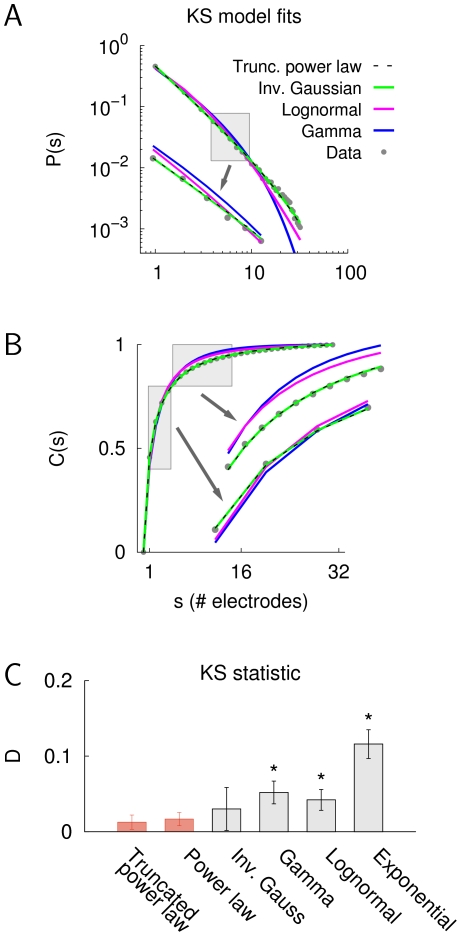
The size distribution of neuronal avalanches in cortical networks has been reported to follow a power law distribution with exponent close to -1.5, which is a reflection of long-range spatial correlations in spontaneous neuronal activity. However, identifying power law scaling in empirical data can be difficult and sometimes controversial. In the present study, we tested the power law hypothesis for neuronal avalanches by using more stringent statistical analyses. In particular, we performed the following steps: (i) analysis of finite-size scaling to identify scale-free dynamics in neuronal avalanches, (ii) model parameter estimation to determine the specific exponent of the power law, and (iii) comparison of the power law to alternative model distributions. Consistent with critical state dynamics, avalanche size distributions exhibited robust scaling behavior in which the maximum avalanche size was limited only by the spatial extent of sampling ("finite size" effect). This scale-free dynamics suggests the power law as a model for the distribution of avalanche sizes. Using both the Kolmogorov-Smirnov statistic and a maximum likelihood approach, we found the slope to be close to -1.5, which is in line with previous reports. Finally, the power law model for neuronal avalanches was compared to the exponential and to various heavy-tail distributions based on the Kolmogorov-Smirnov distance and by using a log-likelihood ratio test. Both the power law distribution without and with exponential cut-off provided significantly better fits to the cluster size distributions in neuronal avalanches than the exponential, the lognormal and the gamma distribution. In summary, our findings strongly support the power law scaling in neuronal avalanches, providing further evidence for critical state dynamics in superficial layers of cortex.
Conflict of interest statement
Figures
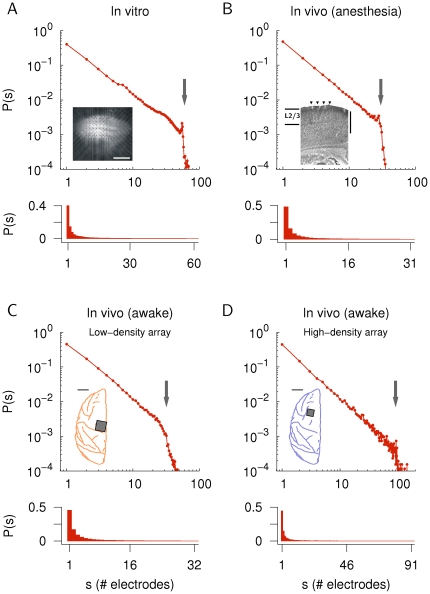
 8 electrode array (scale bar, 1 mm). B. Average in vivo cluster size distribution from rat somatosensory cortex under urethane anesthesia (27–31 electrodes, 7 recordings, n = 22,321 avalanches on average). Data was taken from . Inset: view of the insertion sites for an 8
 4 array (triangles) in cortical layer 2/3 (vertical scale bar, 1 mm). C. 43-min recording for monkey X (low-density microelectrode array with 32 electrodes in the left primary motor cortex, n = 45,574 avalanches). Data was taken from . D. 30-min recording for the second monkey (monkey Y, high-density microelectrode array with 91 electrodes in the left premotor cortex, n = 24,877 avalanches). Insets in C and D show the location of the multielectrode arrays (scale bar, 10 mm). The size of the arrays (dark squares) is not shown in the actual scale. The number of electrodes in the individual arrays is indicated by arrows in the log-log plots (A–D).
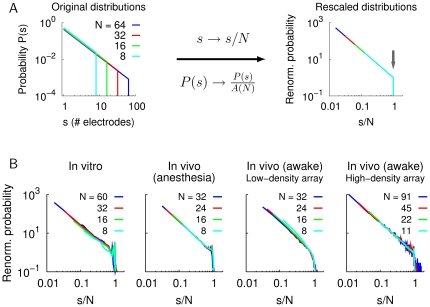
 s/N) and the renormalized probability was obtained according to P(s)
 P(s)/A(N), resulting in a collapse of the cluster size distributions (right). Here, the definition of A(N) with upper bound N was used (Eq. 16). The vertical arrow indicates the system size (scaled to unity). B. Collapse of rescaled cluster size distributions for average in vitro distributions (n = 7), average in vivo distributions under anesthesia (rat, n = 7), and the two awake monkeys with low- and high-density array, respectively (from left to right). Note that the maximum cluster size for all data sets increases with N with the distribution showing a clear cut-off beyond the system size (s/N = 1). The exponent
  for the empirical distributions was fitted individually for each system size N (see
Materials and Methods
).
for the empirical distributions was fitted individually for each system size N (see
Materials and Methods
).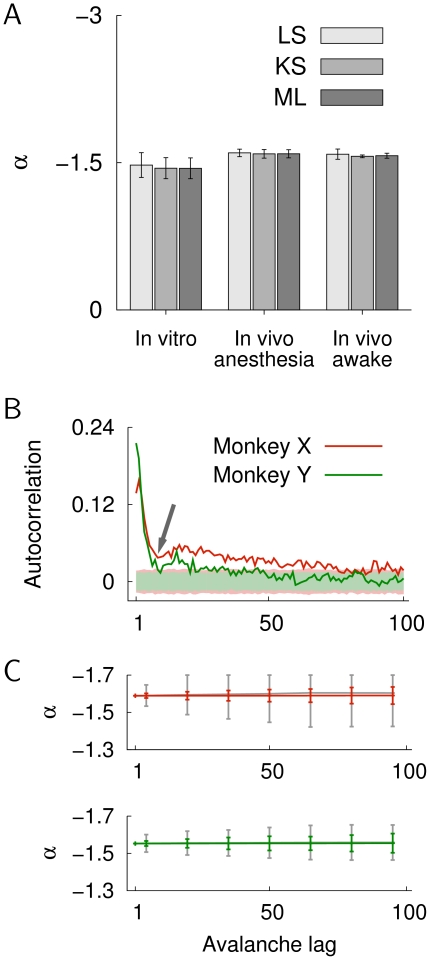
 and the standard deviations (error bars). The three different estimation methods are: LS least-square estimation with logarithmic binning, KS Kolmogorov-Smirnov statistic, and ML maximum likelihood estimation (see
Materials and Methods
). Estimated values of
and the standard deviations (error bars). The three different estimation methods are: LS least-square estimation with logarithmic binning, KS Kolmogorov-Smirnov statistic, and ML maximum likelihood estimation (see
Materials and Methods
). Estimated values of  were not statistically different: in vitro, F(2,18) = 0.19, p = 0.827; in vivo (anesthesia), F(2,18) = 0.124, p = 0.884; in vivo (awake), F(2,3) = 0.21, p = 0.821 (one-way ANOVA). Values of
  were estimated for the entire range of cluster sizes, i.e., from avalanches that included only one electrode to clusters that spanned the entire multielectrode array. B. Autocorrelation of the avalanche sizes for monkey X and Y as a function of the avalanche lag. The autocorrelation showed a fast decay within 10 avalanches (arrow). The shaded areas indicate the autocorrelation (
 3 SD) for randomly permuted cluster sizes for both monkeys. C. Average
  values obtained by ML estimation as a function of avalanche lag for monkey X and Y (red and green line, respectively). Error bars denote the standard deviation across the decorrelated sub-sets. The gray lines show mean
 SD of ML parameter estimates for sample-size matched data from the original sequence of cluster sizes.
Similar articles
-
Statistical properties of avalanches in networks.Phys Rev E Stat Nonlin Soft Matter Phys. 2012 Jun;85(6 Pt 2):066131. doi: 10.1103/PhysRevE.85.066131. Epub 2012 Jun 28. Phys Rev E Stat Nonlin Soft Matter Phys. 2012. PMID: 23005186
-
The recovery of parabolic avalanches in spatially subsampled neuronal networks at criticality.Sci Rep. 2024 Aug 20;14(1):19329. doi: 10.1038/s41598-024-70014-4. Sci Rep. 2024. PMID: 39164334 Free PMC article.
-
Neuronal long-range temporal correlations and avalanche dynamics are correlated with behavioral scaling laws.Proc Natl Acad Sci U S A. 2013 Feb 26;110(9):3585-90. doi: 10.1073/pnas.1216855110. Epub 2013 Feb 11. Proc Natl Acad Sci U S A. 2013. PMID: 23401536 Free PMC article.
-
A simple growth model constructs critical avalanche networks.Prog Brain Res. 2007;165:13-9. doi: 10.1016/S0079-6123(06)65002-4. Prog Brain Res. 2007. PMID: 17925237 Review.
-
Immunological Avalanches in Renal Immune Diseases.Biomedicines. 2025 Apr 21;13(4):1003. doi: 10.3390/biomedicines13041003. Biomedicines. 2025. PMID: 40299571 Free PMC article. Review.
Cited by
-
Heavy-tailed distributions of confirmed COVID-19 cases and deaths in spatiotemporal space.PLoS One. 2023 Nov 21;18(11):e0294445. doi: 10.1371/journal.pone.0294445. eCollection 2023. PLoS One. 2023. PMID: 37988387 Free PMC article.
-
Critical dynamics arise during structured information presentation within embodied in vitro neuronal networks.Nat Commun. 2023 Aug 30;14(1):5287. doi: 10.1038/s41467-023-41020-3. Nat Commun. 2023. PMID: 37648737 Free PMC article.
-
Networks and long-range mobility in cities: A study of more than one billion taxi trips in New York City.Sci Rep. 2020 Mar 4;10(1):4022. doi: 10.1038/s41598-020-60875-w. Sci Rep. 2020. PMID: 32132592 Free PMC article.
-
Development of neural population activity toward self-organized criticality.Neuroscience. 2017 Feb 20;343:55-65. doi: 10.1016/j.neuroscience.2016.11.031. Epub 2016 Nov 30. Neuroscience. 2017. PMID: 27915209 Free PMC article.
-
Divisive normalization is an efficient code for multivariate Pareto-distributed environments.Proc Natl Acad Sci U S A. 2022 Oct 4;119(40):e2120581119. doi: 10.1073/pnas.2120581119. Epub 2022 Sep 26. Proc Natl Acad Sci U S A. 2022. PMID: 36161961 Free PMC article.
References
-
- Bak P, Tang C, Wiesenfeld K. Self-organized criticality. Physical Review A. 1988;38:364–374. - PubMed
Publication types
MeSH terms
Grants and funding
LinkOut - more resources
Full Text Sources
