. 2011 Aug 1;8(3):220-35.
doi: 10.2174/156720211796558069.

Erythropoietin employs cell longevity pathways of SIRT1 to foster endothelial vascular integrity during oxidant stress

Affiliations

Erythropoietin employs cell longevity pathways of SIRT1 to foster endothelial vascular integrity during oxidant stress

Jinling Hou et al. Curr Neurovasc Res. .

Abstract

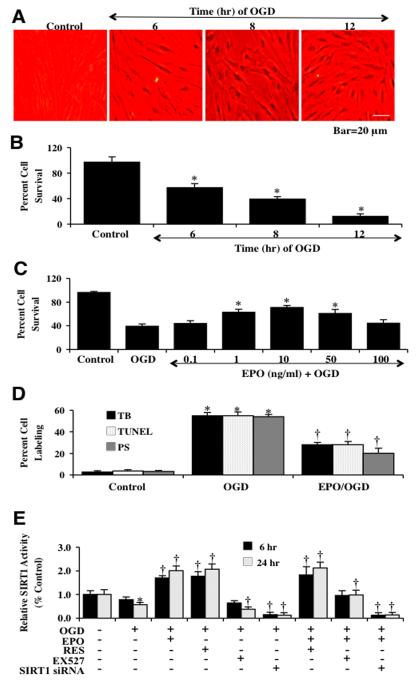
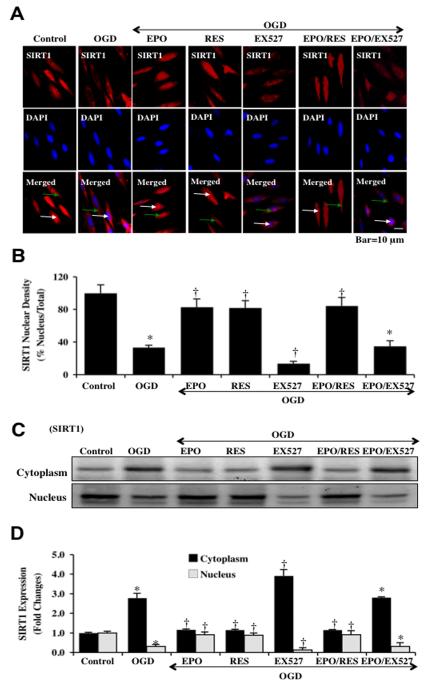
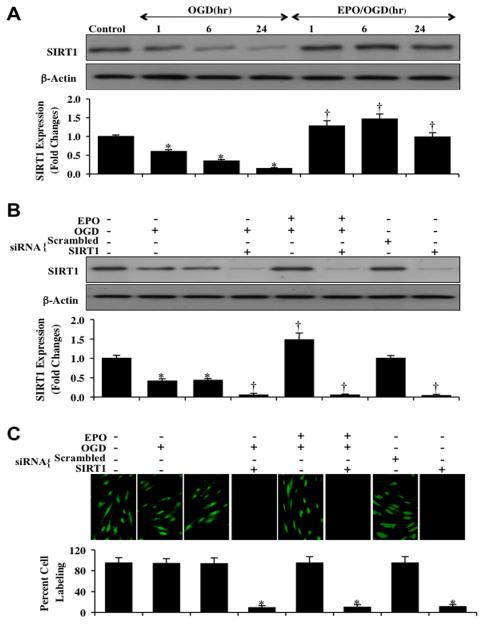
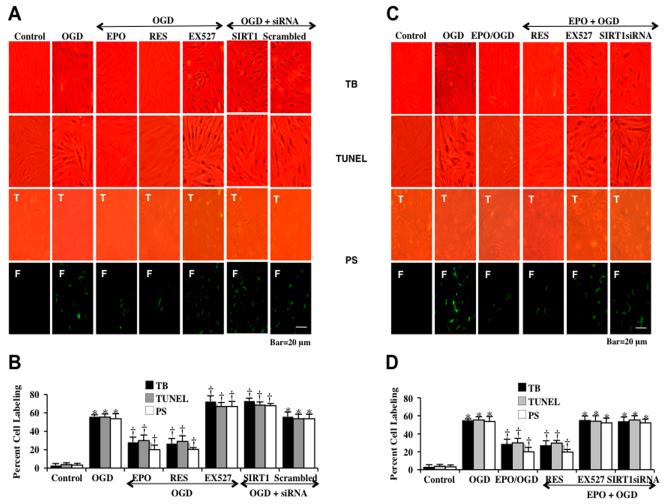
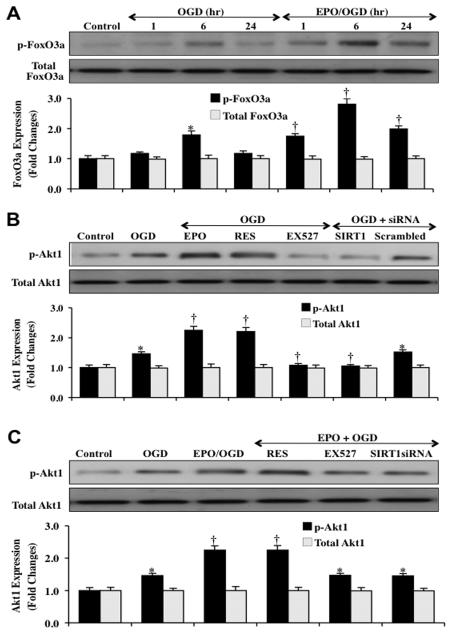
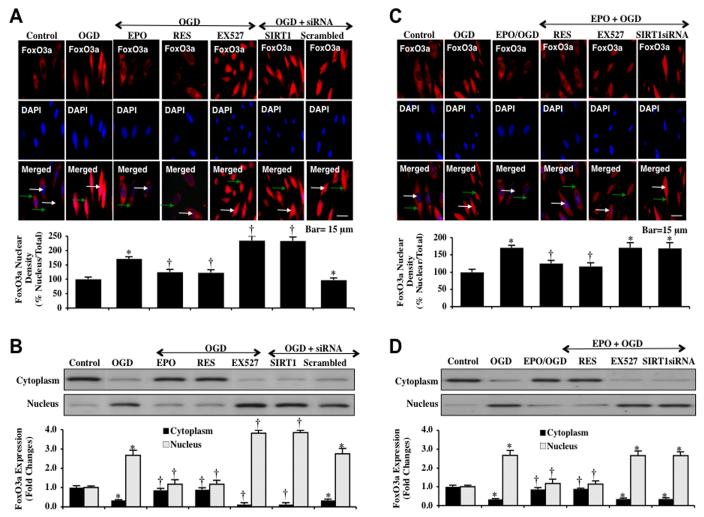
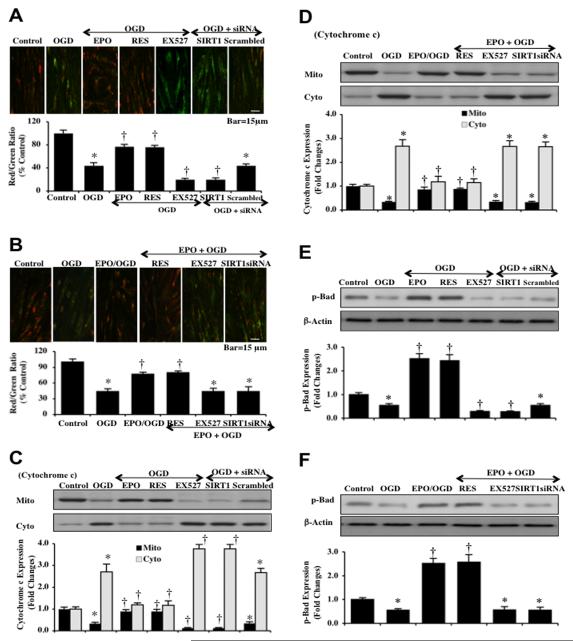
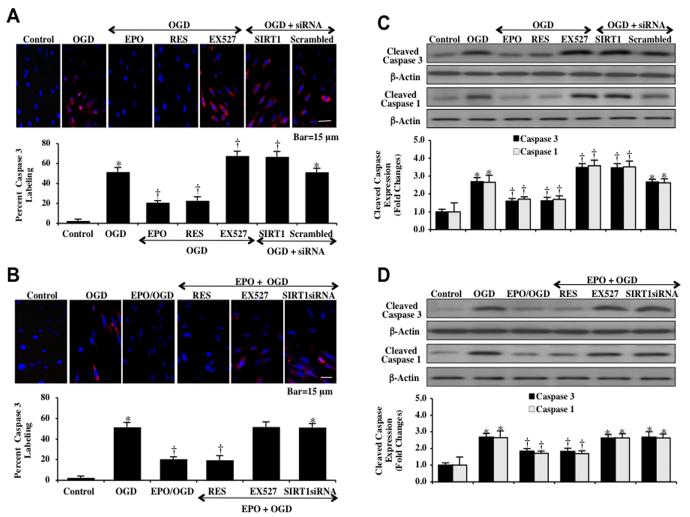
Given the cytoprotective ability of erythropoietin (EPO) in cerebral microvascular endothelial cells (ECs) and the invaluable role of ECs in the central nervous system, it is imperative to elucidate the cellular pathways for EPO to protect ECs against brain injury. Here we illustrate that EPO relies upon the modulation of SIRT1 (silent mating type information regulator 2 homolog 1) in cerebral microvascular ECs to foster cytoprotection during oxygen-glucose deprivation (OGD). SIRT1 activation which results in the inhibition of apoptotic early membrane phosphatidylserine (PS) externalization and subsequent DNA degradation during OGD becomes a necessary component for EPO protection in ECs, since inhibition of SIRT1 activity or diminishing its expression by gene silencing abrogates cell survival supported by EPO during OGD. Furthermore, EPO promotes the subcellular trafficking of SIRT1 to the nucleus which is necessary for EPO to foster vascular protection. EPO through SIRT1 averts apoptosis through activation of protein kinase B (Akt1) and the phosphorylation and cytoplasmic retention of the forkhead transcription factor FoxO3a. SIRT1 through EPO activation also utilizes mitochondrial pathways to prevent mitochondrial depolarization, cytochrome c release, and Bad, caspase 1, and caspase 3 activation. Our work identifies novel pathways for EPO in the vascular system that can govern the activity of SIRT1 to prevent apoptotic injury through Akt1, FoxO3a phosphorylation and trafficking, mitochondrial membrane permeability, Bad activation, and caspase 1 and 3 activities in ECs during oxidant stress.


Figures

Fig. (1)
Fig. (1). EPO increases SIRT1 activity and prevents EC injury during OGD
(A) Primary cerebral ECs were exposed to OGD for 6, 8 and 12 hours and EC survival was determined 24 hours after OGD. Representative images illustrate that OGD leads to progressively increased EC injury over time. Control = untreated EC. (B) Quantitative analysis shows that EC survival was significantly decreased to 57 ± 6% (6 h), 39 ± 4% (8 h), and 12 ± 4% (12 h) after OGD when compared to untreated control cultures (97 ± 8%, *P<0.01 vs. control). Each data point represents the mean and SEM from 6 experiments. (C) A range of EPO dosage (0.1, 1, 10, 50 and 100 ng/ml) was applied 1 h prior to a 8 hour period of OGD, EPO (1-50 ng/ml) significantly reduced trypan blue uptake and increased survival during OGD. The concentration of EPO (10 ng/ml) provides the maximal EC survival. Concentrations lower than 0.1 ng/ml or higher than 50 ng/ml did not improve EC survival during OGD. (D) A significant increase in the staining of trypan blue (TB, 55 ± 4%), apoptotic DNA fragmentation (TUNEL, 55 ± 3 %), phosphatidylserine (PS, 54 ± 6%) exposure 24 hours after a 8 hour period of OGD. In contrast, EPO (10 ng/ml) application significantly reduced cell labeling to 28 ± 1% (TB), 28 ± 2 % (TUNEL), and 20 ± 5% (PS) (*P<0.01 vs. OGD). Each data point represents the mean and SEM from 6 experiments. (E) EPO (10 ng/ml), resveratrol (RES 15 μM), EX527 (2 μM) 1 hour pretreatment and SIRT1 siRNA transfection were assessed with their ability to alter SIRT1 HDAC activity at 6 hours and 24 hours after OGD. HDAC activity in ECs significantly decreased at 24 hours after OGD (*P<0.05 vs. untreated ECs = Control). EPO, RES, or EPO/RES significantly increased HDAC in ECs, while EX527 and SIRT1 siRNA decreased HDAC activity (†P <0.05 vs. OGD). Each data point represents the mean and SEM from 6 experiments.
Fig. (2)
Fig. (2). EPO preserves SIRT1 nuclear shuttling in ECs during OGD
(A) ECs were imaged at 6 hours after OGD with immunofluorescent staining for SIRT1 (Texas-red streptavidin). Nuclei of ECs were counterstained with DAPI. In merged images, untreated control ECs do not have visible nuclei (red in color, white arrows) that illustrate nuclear localization of SIRT1. However, merged images after OGD show ECs with distinctly blue nuclei and red cytoplasm (green arrows) illustrating that SIRT1 is confined to the cytoplasm. In addition, inhibition of SIRT1 catalytic activity with EX527 (2 μM) also confined SIRT1 to the cytoplasm to a greater degree than OGD alone. Yet, EPO (10 ng/ml), resveratrol (RES 15 μM) or EPO/RES during OGD maintained SIRT1 in the nucleus of ECs (*P<0.01 vs. untreated ECs = Control; †P <0.01 vs. OGD). (B) Quantification of the intensity of SIRT1 nuclear staining was performed using the public domain NIH Image program (http://rsb.info.nih.gov/nih-image). Each data point represents the mean and SEM from 6 experiments. (C) Equal amounts of cytoplasmic or nuclear protein extracts (50 μg/lane) were immunoblotted with anti-SIRT1 at 6 hours after OGD. SIRT1 expression is confined to the cytoplasm after OGD, but EPO (10 ng/ml), resveratrol (RES 15 μM), or EPO/RES application leads to the translocation of endogenous SIRT1 from the cytoplasm to the nucleus. SIRT1 inhibitor EX527 (2 μM) prevents the translocation of SIRT1 to the nucleus to a greater level than OGD alone. (D) Quantification of band density of SIRT1 was performed using the public domain NIH Image program (http://rsb.info.nih.gov/nih-image). (*P<0.01 vs. untreated ECs = Control; †P <0.01 vs. OGD). Each data point represents the mean and SEM from 6 experiments.
Fig. (3)
Fig. (3). EPO increases the expression of SIRT1 in ECs during OGD
(A) EC protein extracts (50 μg/lane) were immunoblotted with anti-SIRT1 (SIRT1) at 1, 6 and 24 hours after OGD. SIRT1 expression is progressively reduced over 24 hours after OGD exposure (*P<0.01 vs. control), EPO (10 ng/ml) significantly increased SIRT1 expression at 1, 6 and 24 hours compared with OGD alone (†P <0.01 vs. OGD). (B) EC protein extracts (50 μg/lane) were immunoblotted with anti-SIRT1 (SIRT1) at 6 hours after OGD, gene knockdown of SIRT1 siRNA significantly reduced expression of SIRT1. Non-specific scrambled siRNA did not significantly alter SIRT1 (*P<0.01 vs. untreated ECs = Control; †P <0.01 vs. OGD). Quantification of the western band intensity was performed using the public domain NIH Image program (http://rsb.info.nih.gov/nih-image). (C) Transfection of siRNA against SIRT1 was performed in ECs and the expression of SIRT1 protein was assessed by immunofluorescence. In ECs with SIRT1 gene knockdown, no significant expression of SIRT1 protein is present (*P<0.01 vs. untreated ECs = Control or OGD).
Fig. (4)
Fig. (4). EPO protects against EC injury through blocking apoptotic early phosphatidylserine (PS) exposure and nuclear DNA degradation in ECs during OGD
(A and C) Representative images demonstrate that OGD led to a significant increase in percent trypan blue staining, DNA fragmentation, and membrane PS exposure in ECs at 24 hours after OGD compared to untreated control cultures, which was prevented by EPO (10 ng/ml), resveratrol (RES 15 μM) or EPO/RES combined application. Yet, inhibition of SIRT1 activity with EX527 (2 μM) or gene silence of SIRT1 with siRNA significantly increased apoptotic injury to a greater level during OGD and attenuated the efficacy of EPO. (B and D) Quantification of these results illustrate that EPO (10 ng/ml) application significant decreased percent trypan blue uptake, DNA fragmentation, and membrane PS exposure 24 hours after OGD when compared to OGD treated alone (*P < 0.01 vs. untreated control; †P <0.05 vs. OGD). Inhibition of SIRT1 activity with EX527 (2 μM) or gene silence of SIRT1 with siRNA significantly increased apoptotic injury to a greater level beyond OGD alone and attenuated the efficacy of EPO. Each data point represents the mean and SEM from 6 experiments.
Fig. (5)
Fig. (5). EPO increases the expression of SIRT1, phosphorylated FoxO3a and Akt1 in ECs during OGD
(A) Primary EC protein extracts (50 μg/lane) were immunoblotted with anti-phosphorylated-FoxO3a (p-FoxO3a, Ser253) or anti-total FoxO3a at 1, 6 and 24 hours after OGD. The expression of phospho-FoxO3a (p-FoxO3a) is initially increased at 6 hours but then lost at 24 hours after OGD (*P<0.01 vs. control). EPO (10 ng/ml) one hour pretreatment significantly increased p-FoxO3a expression at 1, 6 and 24 hours compared with OGD alone (†P <0.01 vs. OGD). Quantification of western band intensity was performed using the public domain NIH Image program (http://rsb.info.nih.gov/nih-image). (B and C) Primary EC protein extracts (50 μg/lane) were immunoblotted with anti-phosphorylated-Akt1 (p-Akt1, Ser473) or anti-total Akt1 at 6 hours after OGD. The expression of p-Akt1 (active) was mild increased at 6 hours compared with control (*P<0.01 vs. control) and was further increased by application of EPO (10 ng/ml), resveratrol (RES 15 μM), or EPO/RES (†P <0.01 vs. OGD). Inhibition of SIRT1 activity with EX527 (2 μM) or gene silence of SIRT1 with siRNA abolished the effect of EPO on p-Akt1 expression during OGD (†P <0.01 vs. OGD). Transfection with non-specific scrambled siRNA did not alter the expression of phosphorylated Akt1. Quantification of western band intensity was performed using the public domain NIH Image program (http://rsb.info.nih.gov/nih-image).
Fig. (6)
Fig. (6). EPO controls subcellular trafficking of FoxO3a and retains FoxO3a in the cytoplasm of ECs during OGD
(A and C) ECs were imaged 6 hours after OGD with immunofluorescent staining for FoxO3a (Texas-red streptavidin). Nuclei of ECs were counterstained with DAPI. In merged images, untreated control ECs have visible nuclei (dark blue in color, white arrows) that illustrate absence of FoxO3a in the nucleus and OGD exposure ECs were revealed with completely red cytoplasm (green arrows) and no visible nucleus with DAPI illustrating translocation of FoxO3a to the nucleus. Application of EPO (10 ng/ml), resveratrol (RES 15 μM), or EPO/RES maintains the expression of FoxO3a in the cytoplasm of ECs. However, inhibition of SIRT1 catalytic activity with EX527 (2 μM) or gene silence of SIRT1 with transfection of SIRT1 siRNA (siRNA) during OGD results in significant nuclear translocation of FoxO3a during OGD (*P<0.01 vs. untreated ECs = Control; †P <0.01 vs. OGD). Quantification of the intensity of FoxO3a nuclear staining was performed using the public domain NIH Image program (http://rsb.info.nih.gov/nih-image). Each data point represents the mean and SEM from 6 experiments. (B and D) Equal amounts of cytoplasmic (cytoplasm) or nuclear (nucleus) protein extracts (50 μg/lane) were immunoblotted with anti-FoxO3a at 6 hours after OGD. OGD alone or with the inhibitor of SIRT1 EX527 (2 μM) or transfection with SIRT1 siRNA during OGD induced significant nuclear translocation of FoxO3a. In contrast, EPO (10 ng/ml), resveratrol (RES 15 μM) or EPO/RES retained FoxO3a protein in the cytoplasm during OGD (*P<0.01 vs. untreated ECs = Control; †P <0.01 vs. OGD).
Fig. (7)
Fig. (7). EPO inhibits mitochondrial depolarization, cytochrome c release, and Bad activation through SIRT1 during OGD
(A and B) OGD induces a significant decrease in the red/green fluorescence intensity ratio of mitochondria using the cationic membrane potential indicator JC-1 at 6 hours when compared with untreated control ECs. EPO (10 ng/ml), resveratrol (RES 15 μM), or EPO/RES combined treatment during OGD significantly increased the red/green fluorescence intensity of mitochondria in ECs, demonstrating that mitochondrial membrane potential was restored. In contrast, inhibition of SIRT1 with EX527 (2 μM) and gene silence of SIRT1 with transfection of SIRT1 siRNA (siRNA) worsened mitochondrial membrane depolarization to a greater degree than OGD alone. The relative ratio of red/green fluorescent intensity of mitochondrial staining was measured in 6 independent experiments with analysis performed using the public domain NIH Image program (http://rsb.info.nih.gov/nih-image) (untreated ECs = Control, *P<0.01 vs. Control; †P <0.01 vs. OGD). (C and D) Equal amounts of mitochondrial (mito) or cytosol (cyto) protein extracts (50 μg/lane) were immunoblotted with cytochrome c demonstrating that EPO, RES, EPO/RES significantly prevented cytochrome c release from mitochondria 6 hours after OGD. SIRT1 inhibition (EX527, SIRT1 siRNA) and non-specific scrambled siRNA did not prevent cytochrome c release during OGD. Quantification of the western band intensity was performed using the public domain NIH Image program (http://rsb.info.nih.gov/nihimage) (untreated ECs = Control vs. OGD *P<0.01 vs. Control; †P <0.01 vs. OGD). Each data point represents the mean and SEM from 6 experiments. (E and F) Primary EC protein extracts (50 μg/lane) were immunoblotted with anti-phosphorylated-Bad (p-Bad, Ser136) at 6 hours after OGD. Phosphorylated Bad (p-Bad) expression is promoted by EPO, RES, but is lost during inhibition of SIRT1 or SIRT1 gene knockdown. Non-specific scrambled siRNA during OGD did not change Bad phosphorylation during OGD alone (untreated ECs = Control, *P<0.01 vs. Control; †P <0.01 vs. OGD).
Fig. (8)
Fig. (8). EPO controls caspase 1 and caspase 3 activity during OGD
(A and B) ECs were exposed to OGD and caspase 3 activation was determined 6 hours after OGD through immunocytochemistry with antibody against cleaved active caspase 3 (17 kDa). Representative images illustrate active caspase 3 staining (red) in cells following OGD, but cellular red staining is almost absent in EPO (10 ng/ml) or resveratrol (RES 15 μM) pretreatment. Inhibition of SIRT1 activity with EX527 (2 μM) or gene knockdown of SIRT1 significantly increased active caspase 3 expression to a greater degree in ECs that OGD alone, illustrating that SIRT1 activation was a robust modulator of caspase 3 activity. Non-specific scrambled siRNA did not eliminate caspase 3 activity during OGD. Quantification of caspase 3 immunocytochemistry was performed using the public domain NIH Image program (http://rsb.info.nih.gov/nih-image) (*P <0.01 vs. untreated ECs = Control; †P<0.01 vs. OGD). (C and D) EC protein extracts (50 μg/lane) were immunoblotted with anti-cleaved caspase 3 antibody (active caspase 3, 17 kDa) and with anti-cleaved caspase 1 antibody (active caspase 1, 20 kDa) at 6 hours after OGD. OGD markedly increased cleaved caspase 3 and caspase 1 expression. Transfection with SIRT1 siRNA or inhibition of SIRT1 with EX527 (2 μM) results in a significant elevation in caspase 3 and caspase 1. EPO (10 ng/ml), resveratrol (RES, 15 μM), or EPO/RES combined treatment markedly reduced the expression of cleaved caspase 3 and caspase 1 during OGD. Quantification of western band intensity was performed using the public domain NIH Image program (http://rsb.info.nih.gov/nih-image) (*P <0.01 vs. untreated ECs = Control; †P<0.01 vs. OGD).

References

    1. Bonofiglio R, Lofaro D, Greco R, Senatore M, Papalia T. Proteinuria is a predictor of posttransplant anemia. Transplant Proc. 2011 May;43(4):1063–6. - PubMed
    1. Chong ZZ, Kang JQ, Maiese K. Erythropoietin is a novel vascular protectant through activation of Akt1 and mitochondrial modulation of cysteine proteases. Circulation. 2002 Dec 3;106(23):2973–9. - PubMed
    1. Chong ZZ, Kang JQ, Maiese K. Apaf-1, Bcl-xL, Cytochrome c, and Caspase-9 Form the Critical Elements for Cerebral Vascular Protection by Erythropoietin. J Cereb Blood Flow Metab. 2003 Mar;23(3):320–30. - PubMed
    1. Chong ZZ, Kang JQ, Maiese K. Erythropoietin fosters both intrinsic and extrinsic neuronal protection through modulation of microglia, Akt1, Bad, and caspase-mediated pathways. Br J Pharmacol. 2003 Mar;138(6):1107–18. - PMC - PubMed
    1. Chong ZZ, Maiese K. Erythropoietin involves the phosphatidylinositol 3-kinase pathway, 14-3-3 protein and FOXO3a nuclear trafficking to preserve endothelial cell integrity. Br J Pharmacol. 2007 Apr;150(7):839–50. - PMC - PubMed

Publication types