Review
. 2011:103:115-47.
doi: 10.1016/B978-0-12-385493-3.00006-1.

Analysis of individual molecular events of DNA damage response by flow- and image-assisted cytometry

Affiliations
Review

Analysis of individual molecular events of DNA damage response by flow- and image-assisted cytometry

Zbigniew Darzynkiewicz et al. Methods Cell Biol. 2011.

Abstract

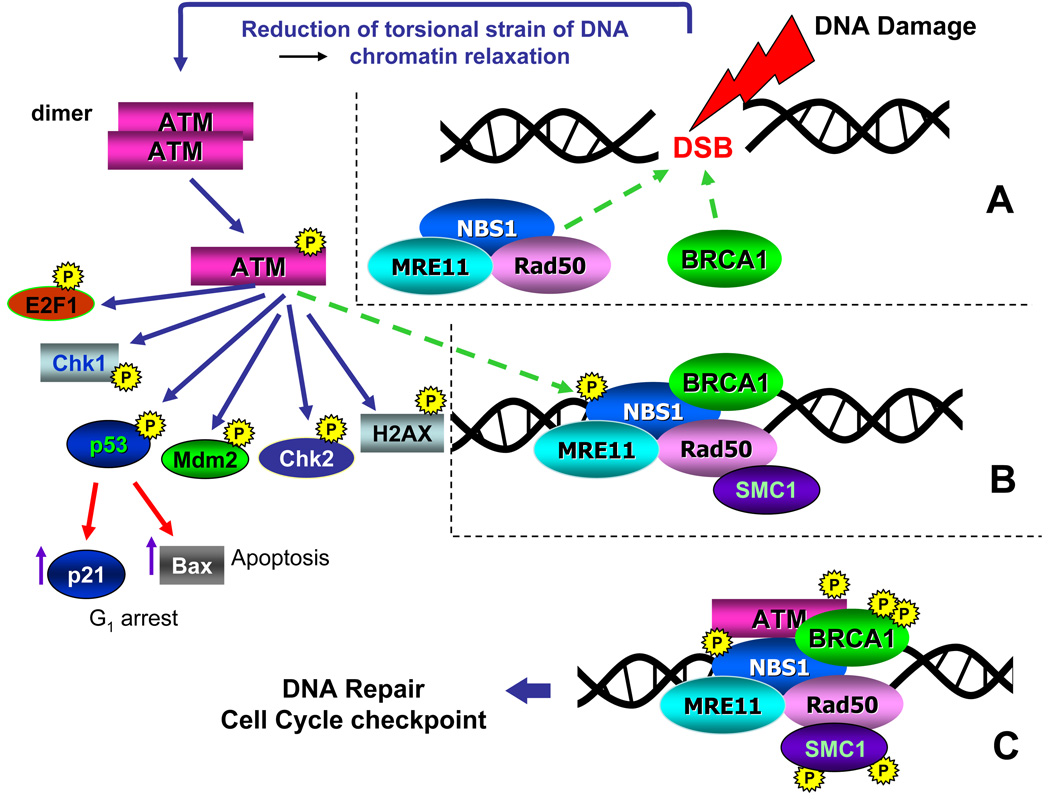
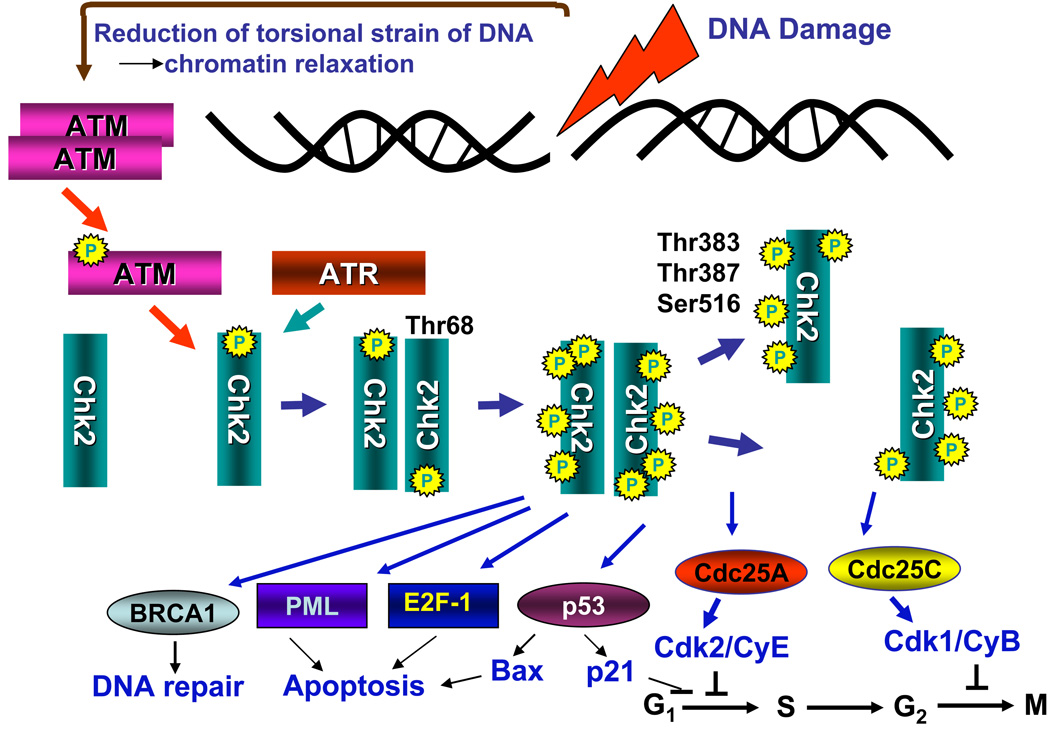
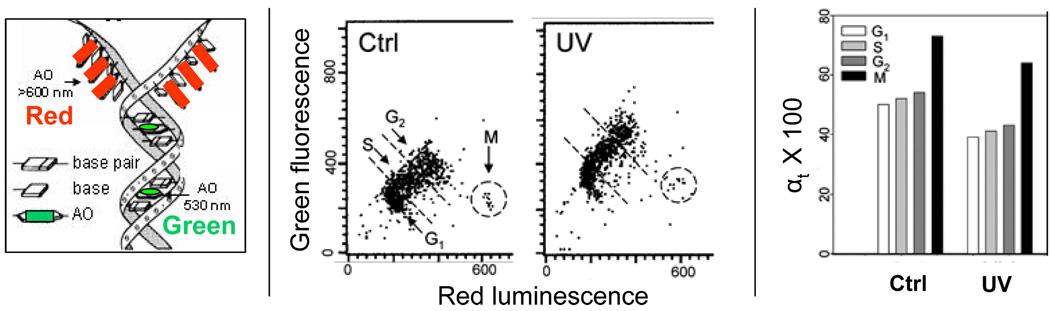
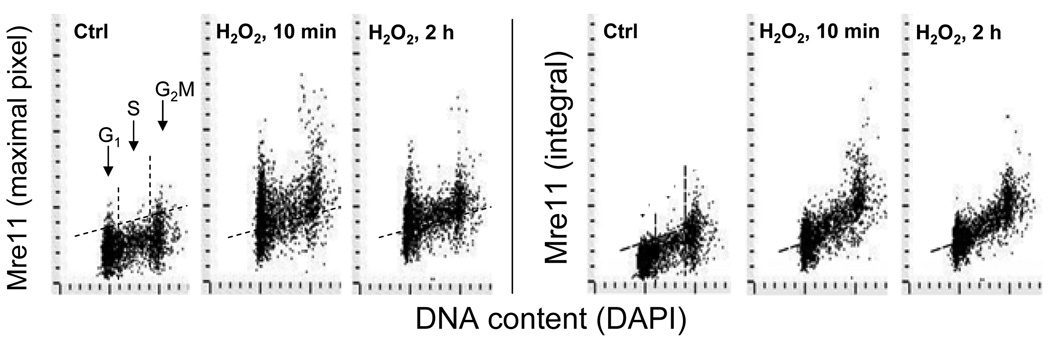
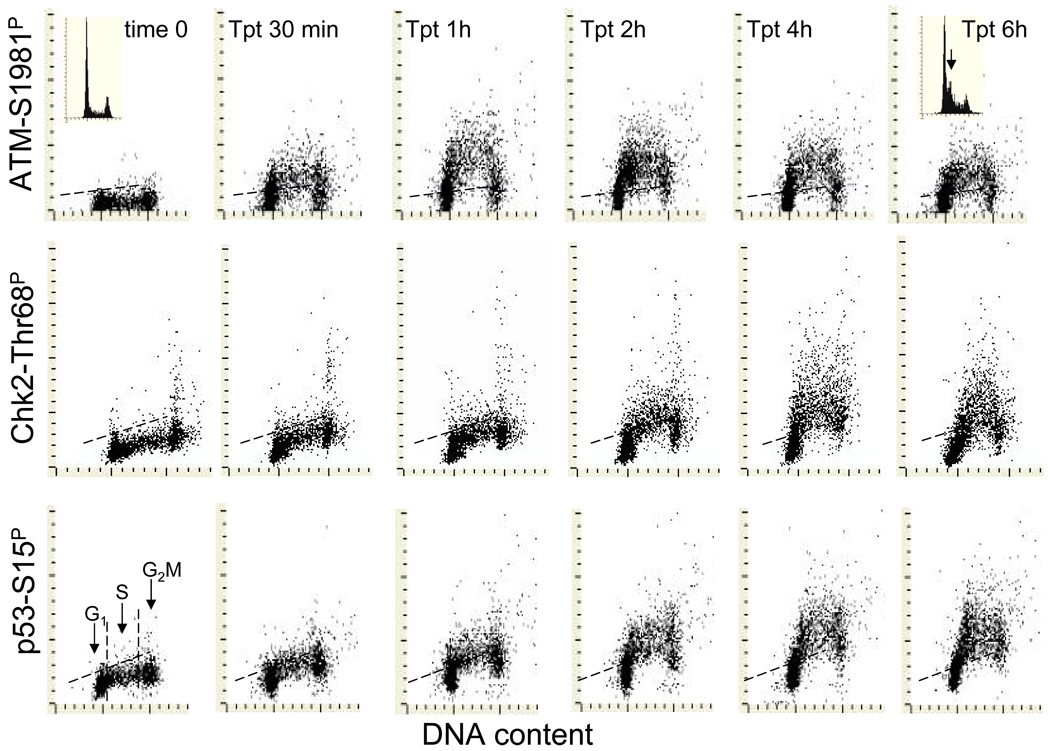
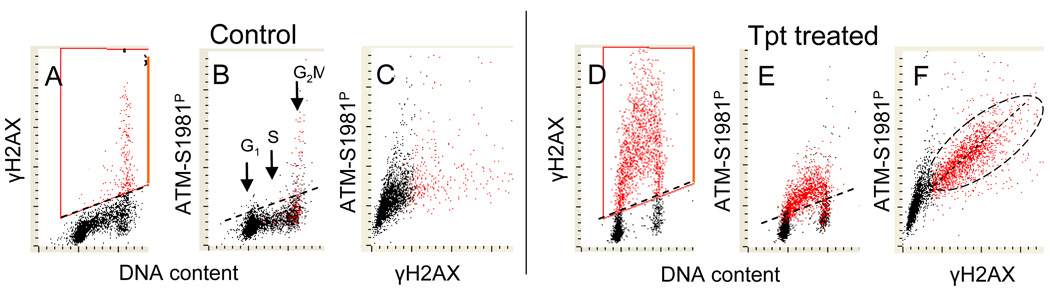
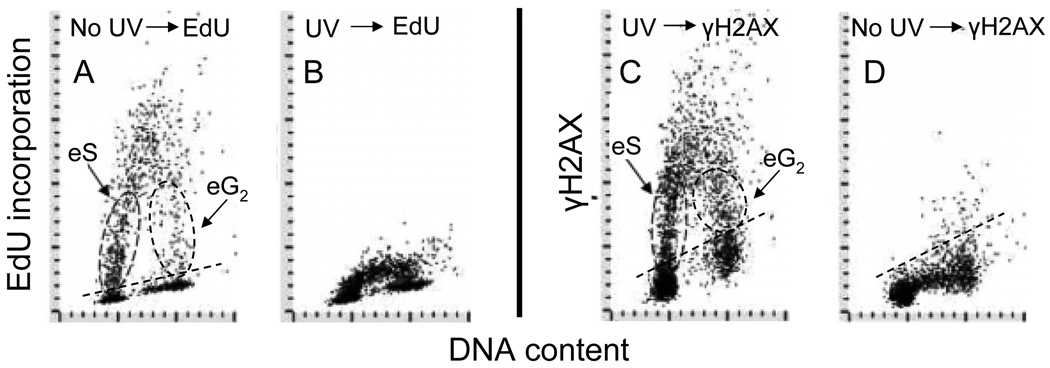
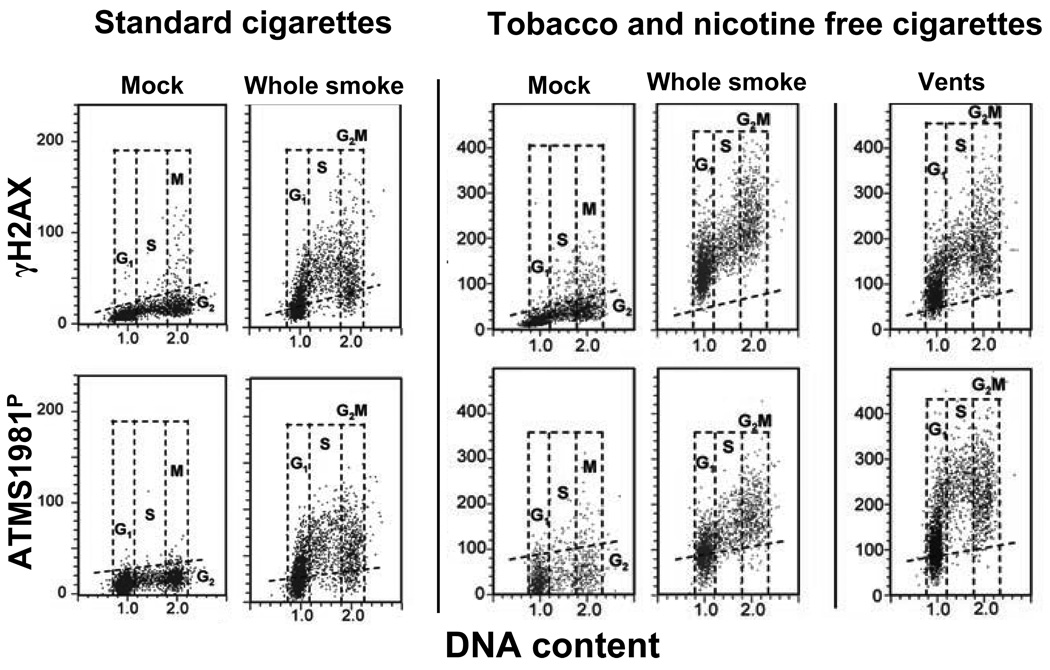
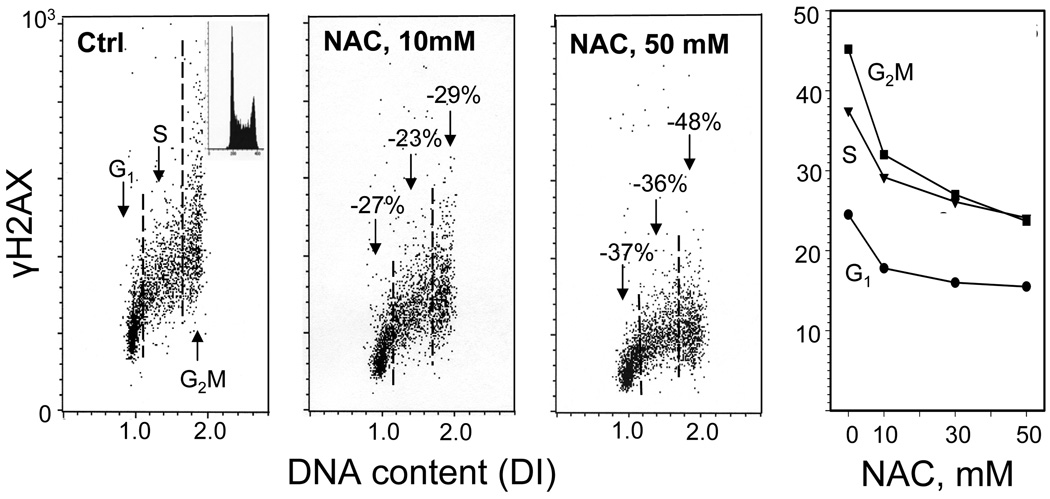
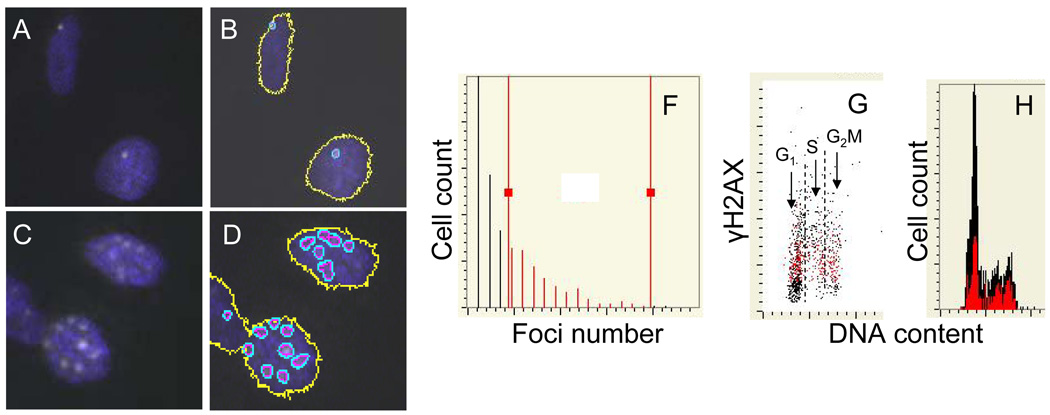
This chapter describes molecular mechanisms of DNA damage response (DDR) and presents flow- and image-assisted cytometric approaches to assess these mechanisms and measure the extent of DDR in individual cells. DNA damage was induced by cell treatment with oxidizing agents, UV light, DNA topoisomerase I or II inhibitors, cisplatin, tobacco smoke, and by exogenous and endogenous oxidants. Chromatin relaxation (decondensation) is an early event of DDR chromatin that involves modification of high mobility group proteins (HMGs) and histone H1 and was detected by cytometry by analysis of the susceptibility of DNA in situ to denaturation using the metachromatic fluorochrome acridine orange. Translocation of the MRN complex consisting of Meiotic Recombination 11 Homolog A (Mre11), Rad50 homolog, and Nijmegen Breakage Syndrome 1 (NMR1) into DNA damage sites was assessed by laser scanning cytometry as the increase in the intensity of maximal pixel as well as integral value of Mre11 immunofluorescence. Examples of cytometric detection of activation of Ataxia telangiectasia mutated (ATM), and Check 2 (Chk2) protein kinases using phospho-specific Abs targeting Ser1981 and Thr68 of these proteins, respectively are also presented. We also discuss approaches to correlate activation of ATM and Chk2 with phosphorylation of p53 on Ser15 and histone H2AX on Ser139 as well as with cell cycle position and DNA replication. The capability of laser scanning cytometry to quantify individual foci of phosphorylated H2AX and/or ATM that provides more dependable assessment of the presence of DNA double-strand breaks is outlined. The new microfluidic Lab-on-a-Chip platforms for interrogation of individual cells offer a novel approach for DDR cytometric analysis.


Figures

Fig. 1
Fig. 1. The ATM signaling pathway triggered by induction of DSBs [(Kitagawa et al. (2004), updated (Darzynkiewicz et al., 2009)]
Induction of DSB leads to lessening of torsional strain and unwinding of DNA superhelical structure which triggers local decondensation of chromatin and recruits the MRE11, RAD50 and NBS1 proteins (MRN complex), as well as BRCA1 to the DSB site (A, dashed arrows). These events activate ATM which occurs by autophosphorylation of Ser1981 and leads to dissociation of the ATM dimer onto two monomers that are enzymatically active. Activated ATM is then recruited to the site of the DSB (B, dashed arrow) where it phosphorylates several substrates including NBS1, BRCA1 and SMC1 (C). NBS1 phosphorylation is required for targeting ATM to phosphorylate Chk1 and Chk2. Phosphorylation of SMC1 activates S-phase checkpoints whereas BRCA1 phosphorylation engages this protein in the DSB repair pathway. ATM also phosphorylates as E2F1, Chk1, p53, Mdm2, Chk2, and H2AX and several other substrates. Activated p53 (phosphorylated on Ser 15) induces transcription of p21WAF1 and/or Bax genes whose protein products arrest cells in G1 or promote apoptosis, respectively.
Fig. 2
Fig. 2. Activation of Chk2 and Chk2’s major substrates
DNA damage (induction of DSBs) triggers activation of ATM (Fig 1) which in turn phosphorylates Chk2 on Thr68 causing its dimerization. Phosphorylation of Chk2 can also be mediated by ATR but this occurs in response to replication stress rather than DSB. Within the dimer of Chk2 phosphorylation at Thr383, Thr387 and Ser516 takes place which leads to dissociation of the dimer onto monomers. Both multiphosphorylated dimers and monomers of Chk2 are enzymatically active and able to phosphorylate the downstream substrates. Among these substrates are the Cdc25C and Cdc25A phosphatases whose phosphorylation by Chk2 promotes binding to a 14-3-3 protein (Rudolph, 2007) thereby preventing translocation into the nucleus and dephosphorylation of inhibitory phospohorylations at Thr14 and Tyr15 on cyclin/CDK complexes. This halts cell cycle transitions from G2 to M (Cdc25C) and G1 to S, (Cdc25A) respectively. Phosphorylation of Cdc25 phosphatases also accelerates their proteasomal degradation (Boutros et al., 2006). A redundant mechanism of cell arrest in G1 involves phosphorylation of p53 by Chk2 which may lead to upregulation of the cdk2 inhibitor p21CIP1/WAF1. Phosphorylation of p53 may also result in upregulation of the proapoptotic protein Bax. Apoptosis may additionally be promoted by phosphorylation of PML and E2F-1. Phosphorylation of BRCA1 engages it in the DNA repair pathway.
Fig. 3
Fig. 3. Relaxation of chromatin of TK6 cells treated with UV light detected as susceptibility of DNA to denaturation after staining with acridine orange (AO)
The left panel shows schematically the principle of differential staining of double-stranded (ds) versus single stranded (ss, denatured) DNA sections with the metachromatic fluorochrome AO. AO binding to ssDNA results in red luminescence (>640 nm) whereas its binding to dsDNA results in green fluorescence (530 nm). (Darzynkiewicz, 1990, Darzynkiewicz and Kapuscinski, 1990, Kapuscinski and Darzynkiewicz 1984a,b). The center panels show bivariate distributions of human leukemic TK6 cells untreated (Ctrl) or exposed to 100 J/m2 UV, then cultured for 30 min, fixed, treated with RNase A, subsequently with 0. 1 M HCl to induce partial DNA denaturation, and then stained with AO at pH 2.6. (Halicka et al., 2009). The extent of DNA denaturation is assessed by flow cytometry as the intensity of red luminescence (ssDNA) and green fluorescence (dsDNA). Note a decrease of red luminescence and an increase of green AO fluorescence of the UV-treated cells compared to control, reporting decondensation of chromatin. DNA in mitotic cells (M) is much more susceptible to denaturation than in interphase cells and this is reflected by their high red and low green intensity of emission (Darzynkiewicz et al., 1977). The G1, S, G2 and M cell subpopulations thus can be identified and gated as shown by the dashed-line borders. The mean intensity of red luminescence (ssDNA) to total (red + green) intensity of emission (reporting ssDNA + dsDNA) was calculated for cells in each of these subpopulations. This DNA denaturation index (reporting approximate fraction of denatured DNA, αt) is plotted (as αt × 100) in the right panel.
Fig. 4
Fig. 4. Detection of Mre11 in A549 cells treated with H2O2
Exponentially growing cells untreated (Ctrl) or treated with 200 µM H2O2 for 10 min or 2 h were fixed and the expression of Mre11 in cell nuclei, detected immunocytochemically, was measured by LSC. Cellular DNA was counterstained with DAPI. Bivariate distributions show expression of Mre11 with respect to the cell cycle phase measured either as maximal pixel or as integrated value of Mre11 immunofluorescence (IF). The dashed skewed lines show the upper threshold level of Mre11 IF for 95% of cells in Ctrl. The maximal increase in Mre11 IF was seen during the initial 10 min followed by a decline (see Zhao et al, 2008 for further details and kinetics data).
Fig. 5
Fig. 5. Kinetics of induction of phosphorylation of ATM on Ser1981, Chk2 on Thr68 and p53 on Ser15 in A549 cells treated with the DNA topoisomerase I inhibitor topotecan (Tpt)
The bivariate distributions of DNA content versus, ATM-S1981P (top), Chk2-Thr68P (mid) and p53-S15P (bottom panels) of A549 cells treated with 150 nM Tpt for up to 6 h. Cells in G1, S and G2M can be identified based on differences in DNA content as marked in the control (time 0) culture. The dashed skewed lines represent the upper threshold level of IF for 97% of interphase (G1 and S) cells in the respective control cultures. The insets in the DNA versus ATM-S1981P distributions show DNA content frequency histograms of cells from time 0 (left) or 6 h Tpt treated (right) cultures. Note the accumulation of cells in early S-phase (arrow) as a result of cell arrest in S by Tpt after 6 h.
Fig. 6
Fig. 6. Correlation between ATM activation and H2AX phosphorylation in A549 cells treated with Tpt
Untreated (Control; A, B,C) and Tpt-treated (150 nM, 1 h; D,E,F) A549 cells were subjected to immunostaining using phosphospecific Abs to differentially label γH2AX and ATM-S1981P with Alexa Fluor 488 and Alexa Fluor 670 Abs, respectively. Cellular DNA was counterstained with DAPI; the emitted blue, green, and far red fluorescence was measured using a three-laser LSC. Using “paint-a-gate” analysis, the cells expressing γH2AX were colored red (A, D). Note that nearly all cells with elevated expression of ATM-1981P (B, E) are red-colored which indicates that H2AX is phosphorylated in the same cells that have activated ATM. On the bivariate distribution of γH2AX versus ATM-S1981P a good correlation between intensity of expression of there phosphoproteins is seen in the Tpt –treated cells (F) (Tanaka et al., 2007a). Among the untreated cells (control) only premitotic and mitotic cells constitutively express γH2AX and ATM-S1981P (Zhao et al., , 2007, 2008c).
Fig. 7
Fig. 7. Correlation between DNA replication and phosphorylation of H2AX after exposure of cells to UV light
Exponentially growing A549 cells, untreated (panels A and D) or exposed to 50 J/m2 of UV-B light (B and C) were incubated for 60 min with 5’-ethynyl-2-deoxyuridine (EdU) then fixed. Incorporation of EdU was detected using the click chemistry approach (Salic and Mitchison, 2008; see Chapter xxxx of this volume) with AlexaFluor® 488 tagged azide (“click-iT™ imaging kit”, Invitrogen/Molecular Probes, Carlsbad, CA), Expression of γH2AX was detected using Alexa Fluor 633 secondary Ab (far red fluorescence), DNA was counterstained with DAPI (Zhao et al., 2019). Subpopulations of cells entering S (eS) and G2 (eG2) during the 60 min pulse with EdU are outlined with the dashed oval lines.
Fig. 8
Fig. 8. Induction of γH2AX and ATM-S1981P in A549 cells after their exposure to either standard (2R4F) cigarette smoke (CS) or to smoke from the tobacco- and nicotine-free cigarettes (T&N free)
Cells were either mock-treated (exposed to the ambient air) or exposed to whole smoke from 2R4F (considered a standard “light cigarette) or to a T&N free cigarette for 20 min and then incubated in culture for 1 h. The right panels (“vents”) shows the cells that were exposed to smoke from T&N-free cigarettes with open vents whose function is to dilute the smoke with air (Jorgensen et al., 2010). The bivariate DNA content (DNA index; DI) versus γH2AX (top panels) or DNA content versus ATM-S1981P (bottom panels) distributions show the expression of γH2AX and ATM-S1981P with respect to the cell cycle phase; cells in G1, S and G2M phases of the cell cycle were identified based on differences in DNA content as shown . The dashed skewed lines indicate the upper threshold for γH2AX or ATM-S1981P IF for 95% of the mock-treated cells.
Fig. 9
Fig. 9. Attenuation of constitutive expression of γH2AX in TK6 cells exposed to N-acetyl-L-cysteine (NAC)
The bivariate (DNA content versus γH2AX IF) distributions show a decrease in the level of constitutive expression of γH2AX in cells growing in the presence of 10 or 50 mM NAC, added into cultures for 1 h prior to cell harvesting compared to the untreated cells (Ctrl). The percent declines in mean values of γH2AX IF of G1, S and G2M phase cell subpopulations in cultures treated with NAC in relation to the respective subpopulations of the untreated (Ctrl) cells, are marked. The inset in the left panel shows the DNA content frequency histogram representative of the cells in these cultures. The right panel shows the plot of the mean values of γH2AX IF for G1, S and G2M cells, estimated by gating analysis, in relation to NAC concentration (Tanaka et al., 2006).
Fig. 10
Fig. 10. Analysis of γH2AX foci by laser scanning cytometry (LSC)
A549 cells were either “mock-treated” (A, B) or exposed to smoke from 2R4F tobacco containing cigarettes for 8 min (C,D) and then incubated in culture for 1 h, as described in the legend to Fig. 8. After fixation the presence of γH2AX was detected immunocytochemically (Albino et al., 2009, Jorgensen et al., 2010). The expression of γH2AX was confined to the characteristic IF foci which were more abundant in the smoke-exposed cells. The LSC software, initially developed to quantify fluorescence in situ hybridization (FISH) foci (Kamentsky et al., 1997) have been used to contour and count images of the γH2AX foci (B,D).The multiparameter analysis of LSC was used to plot the distribution of cells from the smoke-exposed cultures with respect to number of foci per cells (E) and the relationship between expression of γH2AX per nucleus and DNA content (F). The gating analysis was performed to select cells with greater than three foci (F, “red gate”) and through “paint-a-gate” analysis to visualize these cells as colored red on the γH2AX versus DNA content bivariate distribution (F), and their cell cycle position on the DNA content histogram (G).

Similar articles

Cited by

References

    1. Abraham RT, Tibbetts RS. Guiding ATM to broken DNA. Science. 2005;308:510–511. - PubMed
    1. Adams JD, Kim U, Soh HT. Multitarget magnetic activated cell sorter. Proc. Natl. Acad. Sci. USA. 2008;105:18165–18170. - PMC - PubMed
    1. Ahn JY, Li X, Davis HL, Canman CE. Phosphorylation of threonine 68 promotes ologomerization and autophosphorylation of Chk2 protein kinase via the forkhead-associated domain. J. Biol. Chem. 2002;277:19389–19395. - PubMed
    1. Ahn J, Urist M, Prives C. The Chk2 protein kinase. DNA Repair. 2004;3:1039–1047. - PubMed
    1. Albino AP, Huang X, Jorgensen E, Gietl D, Traganos F, Darzynkiewicz Z. Induction of DNA double-strand breaks in A549 and normal human pulmonary epithelial cells by cigarette smoke is mediated by free radicals. Int. J. Oncol. 2006;28:1491–1505. - PubMed

MeSH terms