. 2011 Sep;13(5):528-36.
doi: 10.1016/j.jmoldx.2011.05.006. Epub 2011 Jun 30.

FMR1 intron 1 methylation predicts FMRP expression in blood of female carriers of expanded FMR1 alleles

Affiliations

FMR1 intron 1 methylation predicts FMRP expression in blood of female carriers of expanded FMR1 alleles

David E Godler et al. J Mol Diagn. 2011 Sep.

Abstract

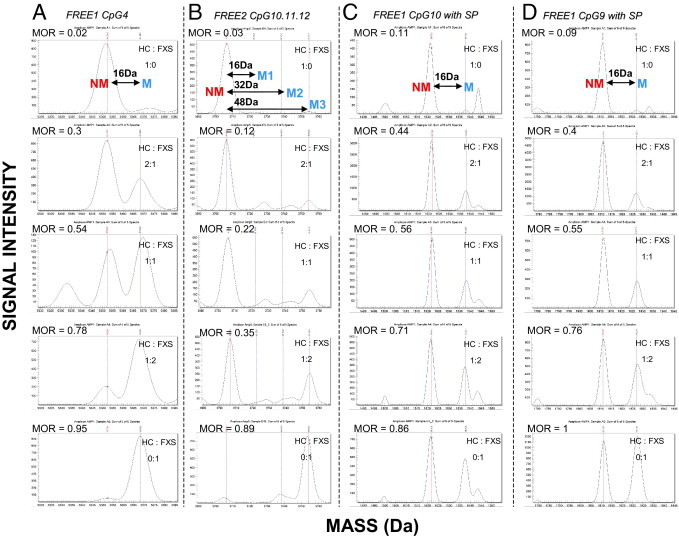
Fragile X syndrome (FXS) is caused by loss of the fragile X mental retardation gene protein product (FMRP) through promoter hypermethylation, which is usually associated with CGG expansion to full mutation size (>200 CGG repeats). Methylation-sensitive Southern blotting is the current gold standard for the molecular diagnosis of FXS. For females, Southern blotting provides the activation ratio (AR), which is the proportion of unmethylated alleles on the active X chromosome. Herein, we examine the relationship of FMRP expression with methylation patterns of two fragile X-related epigenetic elements (FREE) analyzed using matrix-assisted laser desorption/ionization-time-of-flight mass spectrometry and the AR. We showed that the differential methylation of the FREE2 sequence within fragile X mental retardation gene intron 1 was related to depletion of FMRP expression. We also show that, using the combined cohort of 12 females with premutation (55 to 200 CGG repeats) and 22 females with full mutation alleles, FREE2 methylation analysis was superior to the AR as a predictor of the proportion of FMRP-positive cells in blood. Because matrix-assisted laser desorption/ionization-time-of-flight mass spectrometry is amenable to high-throughput processing and requires minimal DNA, these findings have implications for routine FXS testing and population screening.


Figures

Figure 1
Figure 1
Examples of raw mass spectra for selected FREE1 and FREE2 CpG sites from spiked samples. The mass difference between the NM and M fragments for the same CpG site is 16 Da because of the presence of an adenosine residue in the place of a guanosine residue. The EpiTYPER-used software identifies peaks acceptable for analysis, which is presented in the form of the MOR. This ratio represents the relationship between M and NM peaks for the same fragments, which is analogous to total percentage of methylation. Herein, we present raw spectra for spiked samples included during each run used to indicate if there were any technical problems between different plates/runs and whether the results were comparable between the runs. Lymphoblast DNA from an HC male was spiked with lymphoblast DNA form a male affected with FXS at 1:0, 2:1, 1:1, 1:2, and 0:1 ratios, corresponding to 0%, 33.3%, 50%, 66.6%, and 100% (top to bottom), respectively, FXS DNA in the sample. The peaks representing fragments from UM CpG units are represented by red lines, whereas the fragments from methylated CpG units are represented by blue lines. A: CpG4 fragments with no silent peaks. B: FREE2 CpG 10, 11, and 12 fragments of the same size, with the third blue peak representing the combined mass of methylation fragments from all three sites (54 Da away from the UM peak). C: FREE1 CpG 10 fragments with a silent peak contribution evident (bottom panel). D: FREE1 CpG 9 fragments with a silent peak contribution evident (bottom panel). The corresponding MORs from these raw spectra are plotted against FXS DNA input (see Supplemental Figures S2 and S3 at http://jmd.amjpathol.org). MOR indicates methylation output ratio.
Figure 2
Figure 2
The relationship between methylation of specific CpG units within FREE1 and the proportion of FMRP-positive cells in the blood of PM and FM females. MORs for CpG units from 2 to 10 were negatively correlated with the FMRP expression in the cohort of 12 PM and 22 FM females. (Black diamonds indicate FM; white diamonds indicate PM.) Analysis of the MOR was calculated based on the sum of intensities for M/(M + UM signal), as previously described.A: CpG1 did not show a significant correlation with FMRP expression. B: CpG2. C: CpG3. D: CpG4. E: CpG5/6. F: CpG8. G: CpG9. H: CpG10. CpG sites 5 and 6 showed fragment sizes that overlapped using MALDI-TOF analysis and were expressed as the mean methylation value, representing two sites presented as CpG unit 5/6. The broken lines represent the methylation range (mean ± SD) for each CpG unit in HC females, which is listed in Table 1.
Figure 3
Figure 3
The relationship between methylation of specific CpG units within FREE2 and the proportion of FMRP-positive cells in the blood of PM and FM females. MORs for CpG units from 1 to 12 were negatively correlated with the FMRP expression in the combined cohort of 12 PM and 22 FM females. (Black diamonds indicate FM; white diamonds indicate PM.) A: CpG1. B: CpG2. C: CpG 6/7. D: CpG 8/9. E: CpG 10 to 12. An analysis of CpG sites 6 and 7 and CpG sites 8 and 9 showed fragment sizes that overlapped using MALDI-TOF analysis and were expressed as the mean CpG unit methylation value of two sites presented as CpG units 6/7 and 8/9, respectively. The fragment sizes for CpG sites 8, 9, and 10 also overlapped and were presented as the CpG unit 10–12 denominations, representing mean methylation across the three sites. The broken lines represent the methylation range (mean ± SD) for each CpG unit in HC females, which is listed in Table 1.
Figure 4
Figure 4
The correlation between FREE region methylation and FMRP immunostaining in blood of the combined PM and FM cohort of females and between the FMR1 AR and FMRP. A: The relationship between mean methylation across CpG units 2 to 10 of FREE1 and FMRP immunostaining in blood. B: The relationship between mean methylation across CpG units 1 to 12 of FREE2 and FMRP immunostaining in blood. C: The relationship between FMR1 AR, determined using methylation-sensitive (NruI site) SB analysis and FMRP immunostaining in blood. Simple linear regression was performed for AC on the combined cohort of PM and FM females and on only the FM cohort. Black diamonds indicate FM; white diamonds indicate PM.

References

    1. Pieretti M., Zhang F.P., Fu Y.H., Warren S.T., Oostra B.A., Caskey C.T., Nelson D.L. Absence of expression of the FMR-1 gene in fragile X syndrome. Cell. 1991;66:817–822. - PubMed
    1. de Vries B.B., Wiegers A.M., Smits A.P., Mohkamsing S., Duivenvoorden H.J., Fryns J.P., Curfs L.M., Halley D.J., Oostra B.A., van den Ouweland A.M., Niermeijer M.F. Mental status of females with an FMR1 gene full mutation. Am J Hum Genet. 1996;58:1025–1032. - PMC - PubMed
    1. Kaufmann W.E., Abrams M.T., Chen W., Reiss A.L. Genotype, molecular phenotype, and cognitive phenotype: correlations in fragile X syndrome. Am J Med Genet. 1999;83:286–295. - PubMed
    1. Irwin S.A., Galvez R., Greenough W.T. Dendritic spine structural anomalies in fragile-X mental retardation syndrome. Cereb Cortex. 2000;10:1038–1044. - PubMed
    1. Hallahan B.P., Craig M.C., Toal F., Daly E.M., Moore C.J., Ambikapathy A., Robertson D., Murphy K.C., Murphy D.G. In vivo brain anatomy of adult males with fragile X syndrome: an MRI study. Neuroimage. 2011;54:16–24. - PubMed

Publication types

Substances