. 2011 Jul 6;101(1):70-9.
doi: 10.1016/j.bpj.2011.05.034.

Origins and consequences of velocity fluctuations during DNA passage through a nanopore

Affiliations

Origins and consequences of velocity fluctuations during DNA passage through a nanopore

Bo Lu et al. Biophys J. .

Abstract

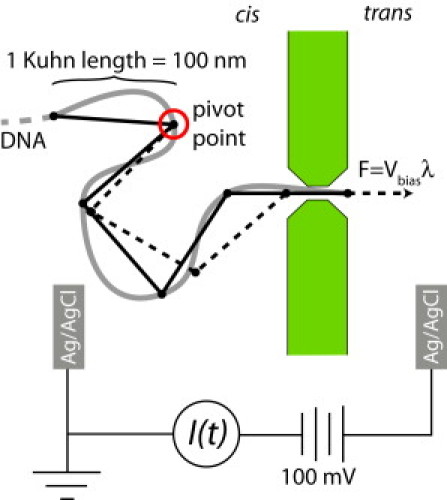
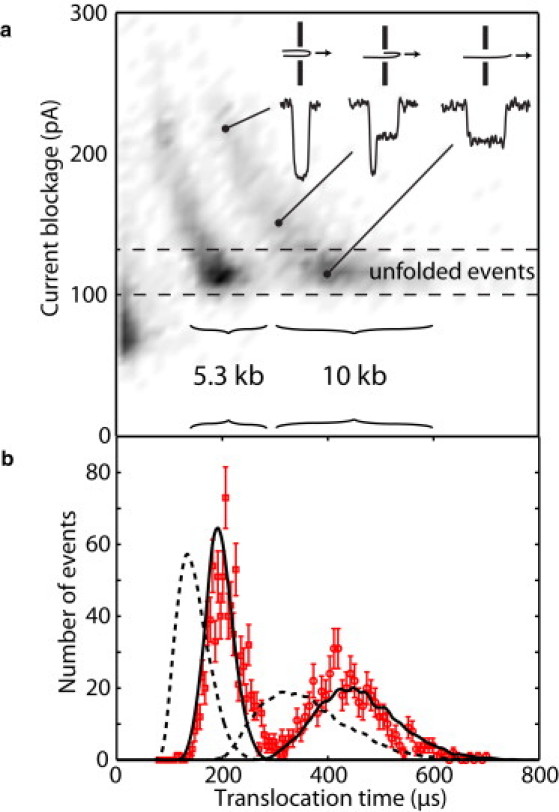
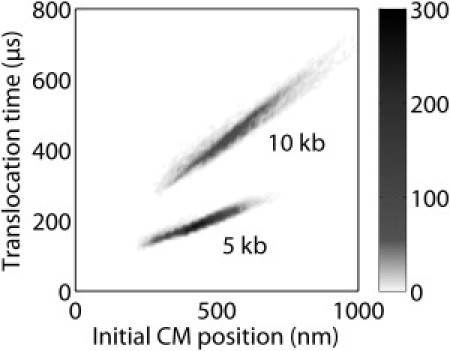
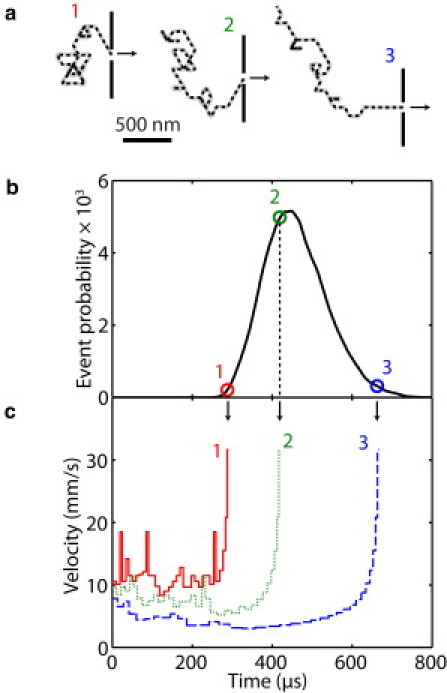
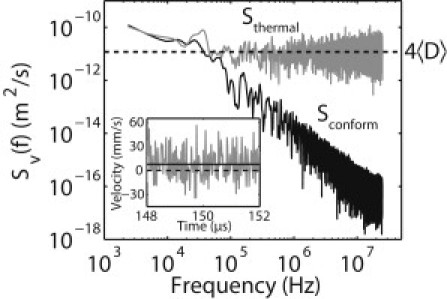
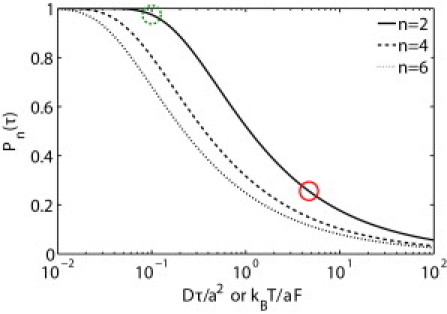
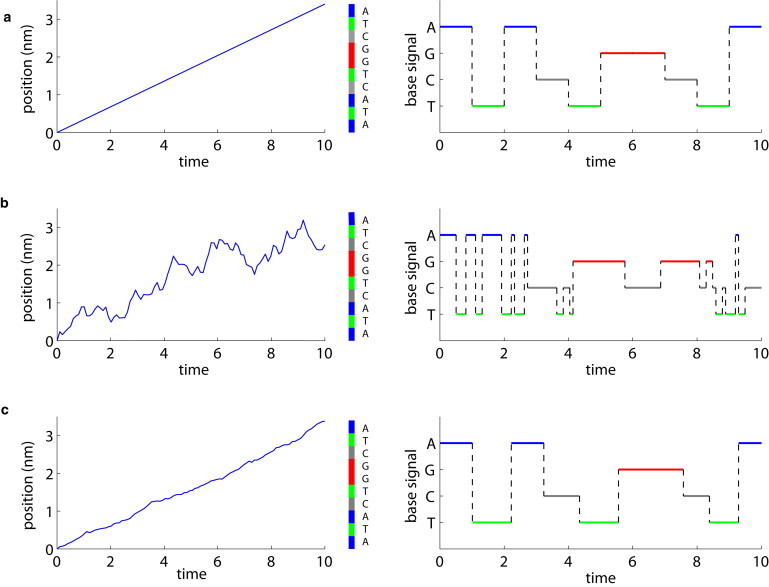
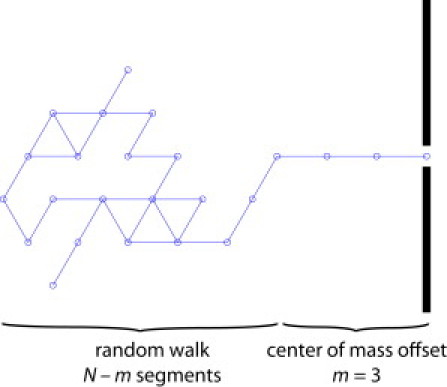
We describe experiments and modeling results that reveal and explain the distribution of times that identical double-stranded DNA (dsDNA) molecules take to pass through a voltage-biased solid-state nanopore. We show that the observed spread in this distribution is caused by viscous-drag-induced velocity fluctuations that are correlated with the initial conformation of nanopore-captured molecules. This contribution exceeds that due to diffusional Brownian motion during the passage. Nevertheless, and somewhat counterintuitively, the diffusional Brownian motion determines the fundamental limitations of rapid DNA strand sequencing with a nanopore. We model both diffusional and conformational fluctuations in a Langevin description. It accounts well for passage time variations for DNA molecules of different lengths, and predicts conditions required for low-error-rate nanopore-strand DNA sequencing with nanopores.


Figures

Figure 1
Figure 1
Geometry of DNA nanopore translocation experiment (schematic) and model. The DNA is rendered as a molecule with smooth conformational changes (shaded) and as a freely jointed chain used in the model (solid and dashed lines). In the model, a “pivot-point” is defined as the (changing) point on the molecule nearest to the nanopore and beyond which its conformation is unchanged as each Kuhn length is driven through the nanopore.
Figure 2
Figure 2
Translocation time distributions. (a) Density histogram of translocation events for 5.3 kb and 10 kb DNA. (Inset) Typical time traces for folded and unfolded events. (b) Translocation time histogram of 1350 unfolded events. (Error bars) Counting error in each histogram bin. The bin size is 4.9 μs for the 5.3 kb data and 7.8 μs for the 10 kb data. (Solid and dashed curves) Predictions of the two-dimensional models with and without a 300-nm center-of-mass offset, respectively.
Figure 3
Figure 3
Distribution of translocation times as a function of initial center-of-mass position from the nanopore. Parameters are those used in the solid curves in Fig. 2.
Figure 4
Figure 4
Examples of velocity and translocation time fluctuations from modeling results of 10-kb DNA molecules. (a) Initial conformations of three otherwise identical molecules with short, average, and long translocation times. (b) Modeled distribution of 10 kb molecules showing the translocation times of the conformations in panel a. (c) Velocity profiles of these three molecules during the translocation event.
Figure 5
Figure 5
Power spectral density Sv(f) of the modeled translocation velocity profile of a 10-kb DNA molecule. (Shaded) Velocity power spectrum including Brownian motion. (Solid curve) Velocity power spectrum from unraveling the initial conformation only. Power spectra were calculated with a Blackman window function and slightly smoothed for clarity. The upper limit of frequency, 25 MHz, is similar to the single base translocation rate in our experiments. (Inset) Four microseconds of a simulated translocation sampled at 50 MHz. (Solid line) Average velocity in this time window. (Dashed line) Zero velocity.
Figure 6
Figure 6
The sequencing probability success rate depends on the ratio of thermal motion to the work done by the driving force to drive a single base through the nanopore. (Solid circle) Current experimental conditions. (Dashed circle) Force necessary to achieve a 95% single-read success rate for two bases.
Figure 7
Figure 7
A 10-base DNA strand passes through a detector with single base resolution under various experimental conditions. Time units are normalized to the average base translocation time τ=a/v¯. (a) If the molecule traverses the detector with a constant speed, the signal recorded will be clear. (b) With Brownian motion at our experimental driving force, the recorded signal is full of errors. (c) By applying a driving force 50 times larger to suppress the relative motion fluctuations (and increasing the solution viscosity by a factor of 50 to maintain the same velocity), the read is much improved.
Figure 8
Figure 8
Illustration of the center-of-mass offset m used to generate the initial molecule conformations. The first m segments are straight; the remaining Nm segments undergo a random walk but are excluded from a distance m from the membrane.

References

    1. Li J., Stein D., Golovchenko J.A. Ion-beam sculpting at nanometre length scales. Nature. 2001;412:166–169. - PubMed
    1. Li J., Gershow M., Golovchenko J.A. DNA molecules and configurations in a solid-state nanopore microscope. Nat. Mater. 2003;2:611–615. - PubMed
    1. Storm A.J., Chen J.H., Dekker C. Translocation of double-strand DNA through a silicon oxide nanopore. Phys. Rev. E Stat. Nonlin. Soft Matter Phys. 2005;71:051903. - PubMed
    1. Fologea D., Gershow M., Li J. Detecting single stranded DNA with a solid state nanopore. Nano Lett. 2005;5:1905–1909. - PMC - PubMed
    1. Meller A., Nivon L., Branton D. Voltage-driven DNA translocations through a nanopore. Phys. Rev. Lett. 2001;86:3435–3438. - PubMed

Publication types

LinkOut - more resources