Review
. 2011 Dec 15:198:232-44.
doi: 10.1016/j.neuroscience.2011.06.048. Epub 2011 Jun 22.

Pathological basal ganglia activity in movement disorders

Affiliations
Review

Pathological basal ganglia activity in movement disorders

T Wichmann et al. Neuroscience. .

Abstract

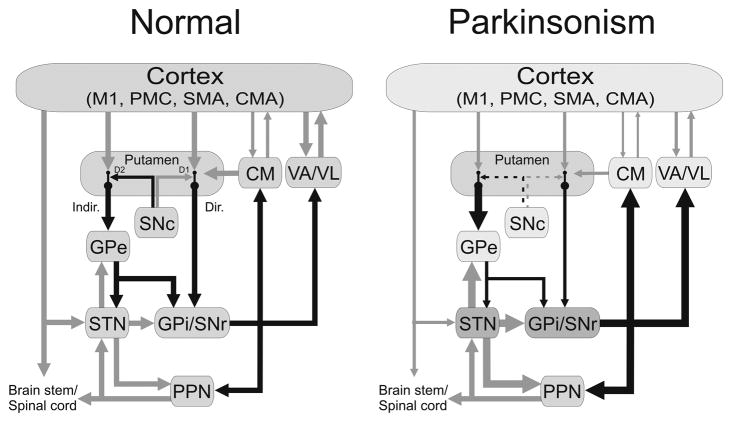
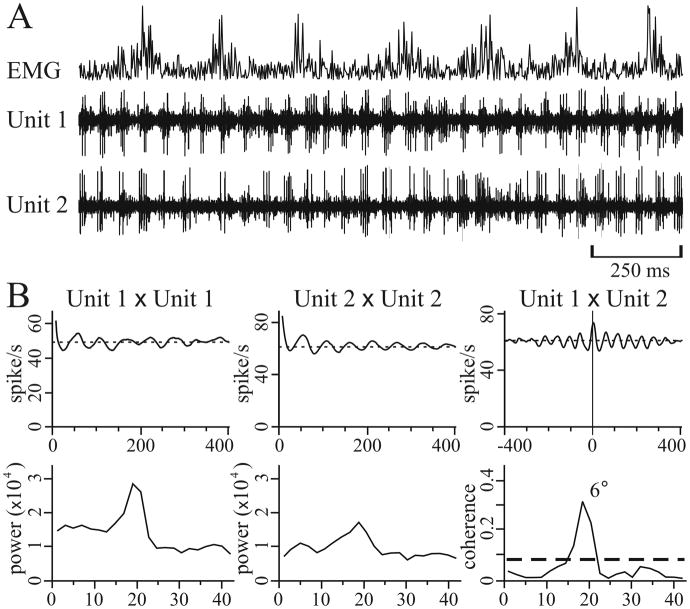
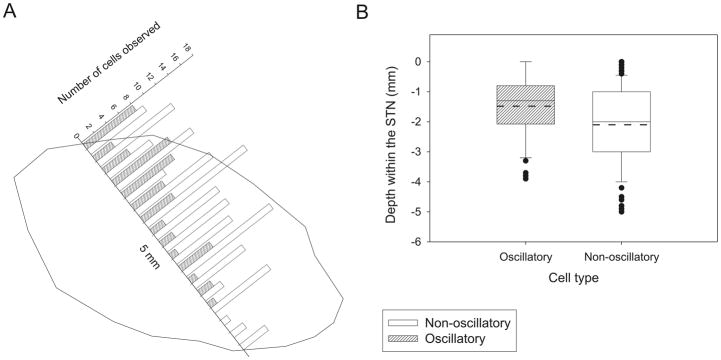
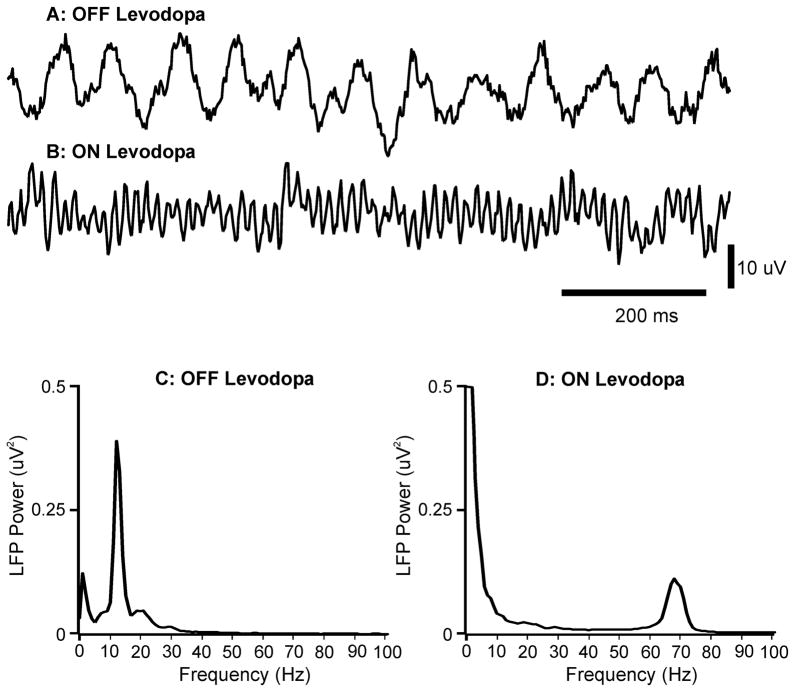
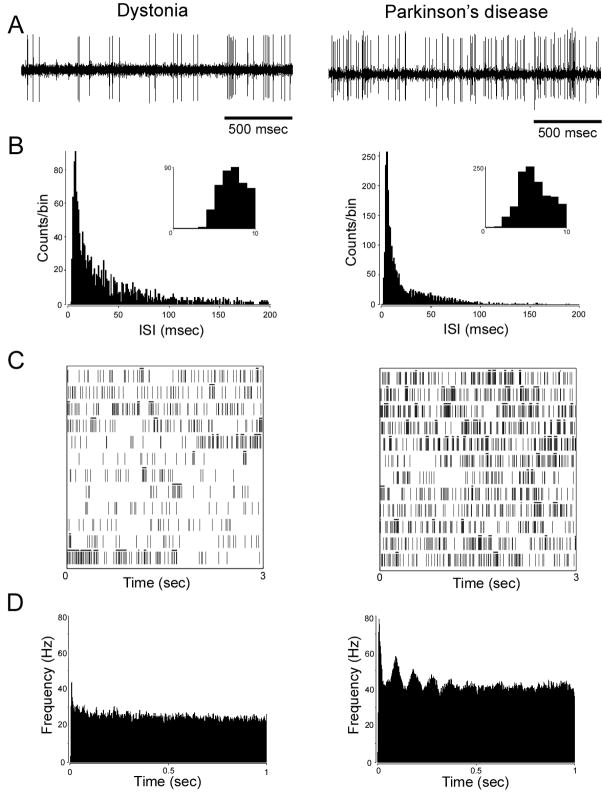
Our understanding of the pathophysiology of movement disorders and associated changes in basal ganglia activities has significantly changed during the last few decades. This process began with the development of detailed anatomical models of the basal ganglia, followed by studies of basal ganglia activity patterns in animal models of common movement disorders and electrophysiological recordings in movement disorder patients undergoing functional neurosurgical procedures. These investigations first resulted in an appreciation of global activity changes in the basal ganglia in parkinsonism and other disorders, and later in the detailed description of pathological basal ganglia activity patterns, specifically burst patterns and oscillatory synchronous discharge of basal ganglia neurons. In this review, we critically summarize our current knowledge of the pathological discharge patterns of basal ganglia neurons in Parkinson's disease, dystonia, and dyskinesias.


Conflict of interest statement

7. Conflicts of interests

The authors declare no actual or potential conflicts of interest.

Figures

Figure 1
Figure 1
Parkinsonism-related changes in overall activity (‘rate model’) in the basal ganglia-thalamocortical motor circuit. Black arrows indicate inhibitory connections; gray arrows indicate excitatory connections. The thickness of the arrows corresponds to their presumed activity. Abbreviations: CM, centromedian nucleus of thalamus; CMA, cingulate motor area; Dir., direct pathway; D1, D2, dopamine receptor subtypes; Indir., indirect pathway; M1, primary motor cortex; Pf, parafascicular nucleus of the thalamus; PMC, premotor cortex; PPN, pedunculopontine nucleus; SMA, supplementary motor area. See text for other abbreviations. Reprinted, with permission, from Galvan and Wichmann (2008).
Figure 2
Figure 2
Example of intraoperative microelectrode recordings in a patient with PD. A, The second and third trace (Unit 1 and Unit 2, respectively) show the discharge activity of two simultaneously recorded STN neurons during wrist tremor, as demonstrated with the recording of rectified wrist extensor electromyographic activity (EMG, top trace). The two neurons generated oscillatory bursts in synchrony with each other. B, Correlograms (top row) and spectra (bottom row) of the traces shown in A (the total sample time used to construct these plots was 29 sec). In all correlograms, the lines indicate mean firing rate. In the cross-correlogram (right panel of top row), Unit 1 is used as the trigger. The thick dashed line in the coherence function indicates the level of significant coherence, and the number by the peak is the phase difference. Reprinted, with permission, from Levy et al (2000).
Figure 3
Figure 3
Distribution of oscillatory and non-oscillatory cells located within the STN in a microelectrode recording study of 14 patients with PD. A. Histogram showing the distribution of oscillatory (n = 56) and nonoscillatory (n =144) cells located within the STN from top to bottom (0 to −5 mm, respectively), binned in 0.3-mm intervals. The x-axis also represents the typical trajectory of a microelectrode track through STN superimposed on the outline of the STN taken from the sagittal 12.0-mm lateral stereotactic STN map (Schaltenbrand and Wahren, 1977). Most of the oscillatory cells were found in the more dorsal portion of the STN, whereas the non-oscillatory cells were equally distributed along the nucleus. B: box plots of oscillatory and non-oscillatory cells’ distribution within the STN. Solid and dashed lines indicate the median and the mean depths, respectively (means ± SE: −1.5 ± 0.1 and −2.1 ± 0.1 mm for oscillatory and nonoscillatory cells, respectively; P < 0.001, t-test). Note the smaller number of observations in the last millimeter of STN attributed to the fact that in many cases the extent of the STN is < 5 mm. Reprinted, with permission, from Weinberger et al. (2006).
Figure 4
Figure 4
Field potential signals recorded in a patient with PD with a macroelectrode positioned in the subthalamic area. A. Field potential signals recorded after overnight withdrawal of medication. B. Field potential signals recorded after subsequent levodopa challenge. C. Power spectrum of field potentials recorded after overnight withdrawal of medication (140 s record). D. Power spectrum of field potential signals recorded after subsequent levodopa challenge (140 s record). There was a spectral peak at around 13 Hz off medication, and at around 70 Hz after levodopa treatment. Reproduced, with permission from Brown and Williams (2005).
Figure 5
Figure 5
Examples of electrophysiological recordings from STN cells in a patient with cranial-cervical dystonia (left column) and a patient with akinetic-rigid parkinsonism (PD, right column). A: A 2-s interval of neuronal recordings. B: interspike interval (ISI) histograms, bin size of 1 ms. Inset: expanded timescale demonstrating the absence of ISIs of <3-ms duration, consistent with the neuronal refractory period. C: raster diagrams showing bursting discharge. Bursts as defined by the Poisson “surprise” method (surprise value = 5) are labeled with a black bar above spikes that constitute a burst. Note the higher proportion of bursts per total number of spikes shown in the dystonia neuron (0.40 vs. 0.26 in the PD neuron). Consecutive rows (3 s of data per row) from bottom to top represent continuous 36-s recordings. D: autocorrelograms. The right autocorrelogram shows oscillatory activity of about 11 Hz. The unit on the left was not found to have significant oscillations. Reprinted, with permission, from Schrock et al. (2009).

References

    1. Albin RL, Young AB, Penney JB. The functional anatomy of basal ganglia disorders. Trends Neurosci. 1989;12:366–375. - PubMed
    1. Alexander GE, Crutcher MD, DeLong MR. Basal ganglia-thalamocortical circuits: parallel substrates for motor, oculomotor, ‘prefrontal’ and ‘limbic’ functions. Prog Brain Res. 1990;85:119–146. - PubMed
    1. Alexander GE, DeLong MR, Strick PL. Parallel organization of functionally segregated circuits linking basal ganglia and cortex. Annu Rev Neurosci. 1986;9:357–381. - PubMed
    1. Alonso-Frech F, Zamarbide I, Alegre M, Rodriguez-Oroz MC, Guridi J, Manrique M, Valencia M, Artieda J, Obeso JA. Slow oscillatory activity and levodopa-induced dyskinesias in Parkinson’s disease. Brain. 2006;129:1748–1757. - PubMed
    1. Aravamuthan BR, Muthusamy KA, Stein JF, Aziz TZ, Johansen-Berg H. Topography of cortical and subcortical connections of the human pedunculopontine and subthalamic nuclei. Neuroimage. 2007;37:694–705. - PubMed

Publication types