

Pulse wave propagation in a model human arterial network: Assessment of 1-D visco-elastic simulations against in vitro measurements
- PMID: 21724188
- PMCID: PMC3278302
- DOI: 10.1016/j.jbiomech.2011.05.041
Pulse wave propagation in a model human arterial network: Assessment of 1-D visco-elastic simulations against in vitro measurements
Abstract
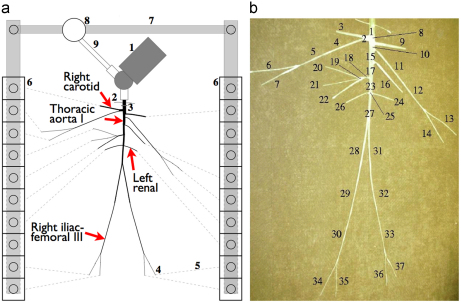
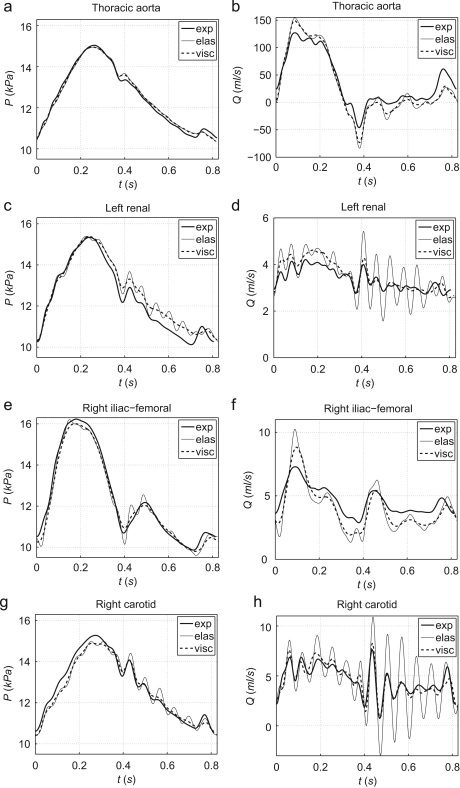
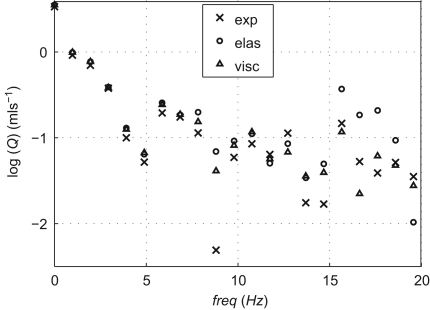
The accuracy of the nonlinear one-dimensional (1-D) equations of pressure and flow wave propagation in Voigt-type visco-elastic arteries was tested against measurements in a well-defined experimental 1:1 replica of the 37 largest conduit arteries in the human systemic circulation. The parameters required by the numerical algorithm were directly measured in the in vitro setup and no data fitting was involved. The inclusion of wall visco-elasticity in the numerical model reduced the underdamped high-frequency oscillations obtained using a purely elastic tube law, especially in peripheral vessels, which was previously reported in this paper [Matthys et al., 2007. Pulse wave propagation in a model human arterial network: Assessment of 1-D numerical simulations against in vitro measurements. J. Biomech. 40, 3476-3486]. In comparison to the purely elastic model, visco-elasticity significantly reduced the average relative root-mean-square errors between numerical and experimental waveforms over the 70 locations measured in the in vitro model: from 3.0% to 2.5% (p<0.012) for pressure and from 15.7% to 10.8% (p<0.002) for the flow rate. In the frequency domain, average relative errors between numerical and experimental amplitudes from the 5th to the 20th harmonic decreased from 0.7% to 0.5% (p<0.107) for pressure and from 7.0% to 3.3% (p<10(-6)) for the flow rate. These results provide additional support for the use of 1-D reduced modelling to accurately simulate clinically relevant problems at a reasonable computational cost.
Copyright © 2011 Elsevier Ltd. All rights reserved.
Figures
Similar articles
-
Pulse wave propagation in a model human arterial network: assessment of 1-D numerical simulations against in vitro measurements.J Biomech. 2007;40(15):3476-86. doi: 10.1016/j.jbiomech.2007.05.027. Epub 2007 Jul 20. J Biomech. 2007. PMID: 17640653
-
Numerical assessment of time-domain methods for the estimation of local arterial pulse wave speed.J Biomech. 2011 Mar 15;44(5):885-91. doi: 10.1016/j.jbiomech.2010.12.002. Epub 2011 Jan 5. J Biomech. 2011. PMID: 21211799 Free PMC article.
-
Experimental validation of a time-domain-based wave propagation model of blood flow in viscoelastic vessels.J Biomech. 2008;41(2):284-91. doi: 10.1016/j.jbiomech.2007.09.014. Epub 2007 Nov 26. J Biomech. 2008. PMID: 18031750
-
The numerical analysis of fluid-solid interactions for blood flow in arterial structures. Part 2: Development of coupled fluid-solid algorithms.Proc Inst Mech Eng H. 1998;212(4):241-52. doi: 10.1243/0954411981534024. Proc Inst Mech Eng H. 1998. PMID: 9769692 Review.
-
Generic and patient-specific models of the arterial tree.J Clin Monit Comput. 2012 Oct;26(5):375-82. doi: 10.1007/s10877-012-9382-9. Epub 2012 Jul 29. J Clin Monit Comput. 2012. PMID: 22843240 Review.
Cited by
-
Hemodynamics.Compr Physiol. 2016 Mar 15;6(2):975-1003. doi: 10.1002/cphy.c150038. Compr Physiol. 2016. PMID: 27065172 Free PMC article. Review.
-
The multi-scale modelling of coronary blood flow.Ann Biomed Eng. 2012 Nov;40(11):2399-413. doi: 10.1007/s10439-012-0583-7. Epub 2012 May 8. Ann Biomed Eng. 2012. PMID: 22565815 Free PMC article. Review.
-
Numerical Method of Characteristics for One-Dimensional Blood Flow.J Comput Phys. 2015 Aug 1;294:96-109. doi: 10.1016/j.jcp.2015.03.045. J Comput Phys. 2015. PMID: 25931614 Free PMC article.
-
Automated generation of 0D and 1D reduced-order models of patient-specific blood flow.Int J Numer Method Biomed Eng. 2022 Oct;38(10):e3639. doi: 10.1002/cnm.3639. Epub 2022 Aug 14. Int J Numer Method Biomed Eng. 2022. PMID: 35875875 Free PMC article.
-
A Coupled Lumped-Parameter and Distributed Network Model for Cerebral Pulse-Wave Hemodynamics.J Biomech Eng. 2015 Oct;137(10):101009. doi: 10.1115/1.4031331. J Biomech Eng. 2015. PMID: 26287937 Free PMC article.
References
-
- Alastruey, J., 2006. Numerical Modelling of Pulse Wave Propagation in the Cardiovascular System: Development, Validation and Clinical Applications. Ph.D. Thesis, Imperial College London, University of London, UK.
-
- Alastruey J., Parker K., Peiro J., Sherwin S. Can the modified Allen's test always detect sufficient collateral flow in the hand? A computational study. Comp. Meth. Biomech. Biomed. Eng. 2006;9:353–361. - PubMed
-
- Armentano R., Barra J., Levenson J., Simon A., Pichel R. Arterial wall mechanics in conscious dogs: assessment of viscous, inertial, and elastic moduli to characterize aortic wall behavior. Circ. Res. 1995;76:468–478. - PubMed
-
- Armentano R., Megnien J., Simon A., Bellenfant F., Barra J., Levenson J. Effects of hypertension on viscoelasticity of carotid and femoral arteries in humans. Hypertension. 1995;26:48–54. - PubMed
Publication types
MeSH terms
Substances
Grants and funding
LinkOut - more resources
Full Text Sources
Other Literature Sources
