. 2011 Dec;118(12):2434-41.
doi: 10.1016/j.ophtha.2011.05.008. Epub 2011 Jul 2.

Natural history of drusen morphology in age-related macular degeneration using spectral domain optical coherence tomography

Affiliations

Natural history of drusen morphology in age-related macular degeneration using spectral domain optical coherence tomography

Zohar Yehoshua et al. Ophthalmology. 2011 Dec.

Abstract

Purpose: To characterize the natural history of drusen using spectral-domain optical coherence tomography (SD-OCT) imaging of eyes from patients with nonexudative age-related macular degeneration (AMD).

Design: Prospective, longitudinal, natural history study.

Participants: We included 143 eyes of 100 patients with at least 6 months of follow-up.

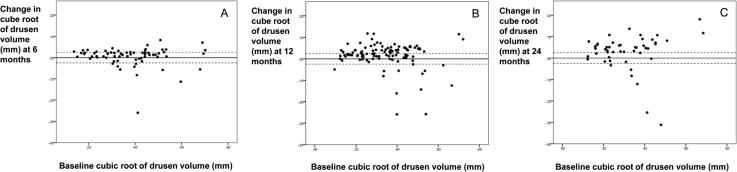
Methods: Patients with drusen secondary to nonexudative AMD were scanned using the Cirrus SD-OCT instrument. Eyes were imaged using the 200 × 200 A-scan raster pattern contained within a 6 × 6 mm area. Custom software was used to quantify volumetric changes in drusen over a period of ≥ 6 months and for as long as 24 months. Drusen volume and drusen area were measured within circular regions centered at the fovea having diameters of 3 and 5 mm. The measurements were analyzed using a suitable scale transformation. For drusen volume, a cube root transformation strategy was used.

Main outcome measures: Change in drusen volume and area over time.

Results: We analyzed 143 eyes of 100 patients with 69 eyes followed for 6 months, 106 eyes followed for 12 months, 48 eyes followed for 18 months, and 48 eyes followed for 24 months. The 3 mm circle baseline drusen volume ranged from 0.0009 to 0.7479 mm(3) or 0.10 to 0.91 mm using the cube root scale. On average, drusen volume and drusen area increased over time with the magnitude of the increase dependent on the length of follow-up (P = 0.001, 3 mm circle). In the eyes with a decrease in drusen volume, the magnitude of this decrease was dependent on the baseline drusen volume (P = 0.001, 3 mm circle) and independent of the follow-up interval. After 12 months, drusen volume increased in 48% of eyes, remained stable in 40%, and decreased in 12%.

Conclusions: Imaging with SD-OCT revealed a dynamic, undulating growth pattern for drusen with a tendency for drusen to increase in volume and area over time. An appreciation of the quantitative changes in drusen volume over time using SD-OCT imaging provides a novel strategy for following normal disease progression and for identifying novel clinical trial end points to be used when investigating therapies for the treatment of nonexudative AMD.

Financial disclosure(s): Proprietary or commercial disclosure may be found after the references.


Figures

Figure 1
Figure 1
Relationship between the change in the square root of drusen area at 6, 12, and 24 months, and the square root of drusen area at baseline. A. Scatter plot showing the change in the square root of drusen area (3mm circle) after 6 months, as a function of the square root of drusen area at baseline. B. Scatter plot showing the change in the square root of drusen area (3mm circle) after 12 months, as a function of the square root of drusen area at baseline. C. Scatter plot showing the change in the square root of drusen area (3mm circle) after 24 months, as a function of the square root of drusen area at baseline.
Figure 2
Figure 2
Relationship between the change in the cube root of drusen volume at 6, 12, and 24 months, and the cube root of drusen volume at baseline A. Scatter plot showing the change in the cube root of drusen volume (3mm circle) after 6 months, as a function of the cube root of drusen volume at baseline. B. Scatter plot showing the change in the cube root of drusen volume (3mm circle) after 12 months, as a function of the cube root of drusen volume at baseline. C. Scatter plot showing the change in the cube root of drusen volume (3mm circle) after 24 months, as a function of the cube root of drusen volume at baseline.
Figure 3
Figure 3
Right eye of a 64 year old woman with drusen followed over 6 months. Drusen were found to increase in volume and then regress spontaneously with resolution of the drusen on color fundus photo but without progression to advanced AMD. Color fundus photo with a line representing the location of the Optical Coherence Tomography (OCT) B scan (A,E,I), horizontal B-scan (B,F,J), Retinal pigment epithelium segmentation map (C,G,K), and hybrid map made of OCT fundus image and drusen thickness map (D,H,L). Images are shown at baseline (A–D), at 3 months of follow-up (E–H), and at 6 months of follow-up (I–L). Drusen volume was calculated to be 0.21 mm3 at baseline (D), 0.26 mm3 at 3 months of follow-up (H), and 0.001 mm3 at 6 months of follow up.
Figure 4
Figure 4
Right eye of a 75 year old woman with drusen followed over 6 months. Drusen were found to remain stable over 18 months of follow-up. Color fundus photo with a line representing the location of the Optical Coherence Tomography (OCT) B scan (A,E), horizontal B scan (B,F), Retinal pigment epithelium segmentation map (C,G), and hybrid map made of OCT fundus image and drusen thickness map (D,H). Images are shown at baseline (A–D) and at 18 months (E–H). Drusen volume was calculated to be 0.15 mm3 at baseline (D) and 0.15 mm3 at 18 months (H).
Figure 5
Figure 5
Left eye of a 64 year old woman with drusen followed over 6 months. Drusen were found to increase in volume and then regress spontaneously but without resolution of the drusen on color fundus photo and eventual development of choroidal neovascularization with intraretinal fluid. Color fundus photo with a line representing the location of the Optical Coherence Tomography (OCT) B scan (A,E,I,M), horizontal B scan (B,F,J,N), Retinal pigment epithelium segmentation map (C,G,K,O), and hybrid map made of OCT fundus image and drusen thickness map (D,H,L,P). Images are shown at baseline (A–D), at 6 months of follow-up (E–H), at 12 months of follow-up (I–L), and at 15 months of follow-up. Drusen volume was calculated to be 0.19 mm3 at baseline (D), 0.23 mm3 at 6 months (H), and 0.028 mm3 (L) at 12 months.
Figure 6
Figure 6
Right eye of a 76 year old woman with drusen followed over 6 months. Drusen were found to change to geographic atrophy over 12 months. Color fundus photo with a line representing the location of the Optical Coherence Tomography (OCT) B scan (A,F), horizontal B scan (B,G), Retinal pigment epithelium segmentation map (C,H), hybrid map made of OCT fundus image and drusen thickness map (D,I) and fundus autofluorescence (E,J). Images are shown at baseline (A–E), and at 12 months (F–J). Drusen volume was calculated to be 0.45 mm3 at baseline (D) and 0.016 mm3 at 12 months (H). At 12 months geographic atrophy appears with an area of 1.28 mm2.

Comment in

  • Drusen volume as a study endpoint.
    Maguire MG. Maguire MG. Ophthalmology. 2012 Jul;119(7):1501-2; author reply 1502. doi: 10.1016/j.ophtha.2012.03.012. Ophthalmology. 2012. PMID: 22749098 No abstract available.

References

    1. Klein R, Klein BE, Tomany SC, et al. Ten-year incidence and progression of age-related maculopathy: The Beaver Dam eye study. Ophthalmology. 2002;109:1767–79. - PubMed
    1. Ferris FL, Davis MD, Clemons TE, et al. A simplified severity scale for age-related macular degeneration: AREDS Report No. 18. Arch Ophthalmol. 2005;123:1570–4. - PMC - PubMed
    1. Seddon JM, Sharma S, Adelman RA. Evaluation of the clinical age-related maculopathy staging system. Ophthalmology. 2006;113:260–6. - PubMed
    1. Pauleikhoff D, Barondes MJ, Minassian D, et al. Drusen as risk factors in age-related macular disease. Am J Ophthalmol. 1990;109:38–43. - PubMed
    1. Klein R, Klein BE, Knudtson MD, et al. Fifteen-year cumulative incidence of age-related macular degeneration: the Beaver Dam Eye Study. Ophthalmology. 2007;114:253–62. - PubMed

Publication types