Comparative Study
. 2011 Oct;108(6):1179-94.
doi: 10.1093/aob/mcr126. Epub 2011 Jul 1.

Modelling the effect of wheat canopy architecture as affected by sowing density on Septoria tritici epidemics using a coupled epidemic-virtual plant model

Affiliations
Comparative Study

Modelling the effect of wheat canopy architecture as affected by sowing density on Septoria tritici epidemics using a coupled epidemic-virtual plant model

Rim Baccar et al. Ann Bot. 2011 Oct.

Abstract

Background and aims: The relationship between Septoria tritici, a splash-dispersed disease, and its host is complex because of the interactions between the dynamic plant architecture and the vertical progress of the disease. The aim of this study was to test the capacity of a coupled virtual wheat-Septoria tritici epidemic model (Septo3D) to simulate disease progress on the different leaf layers for contrasted sowing density treatments.

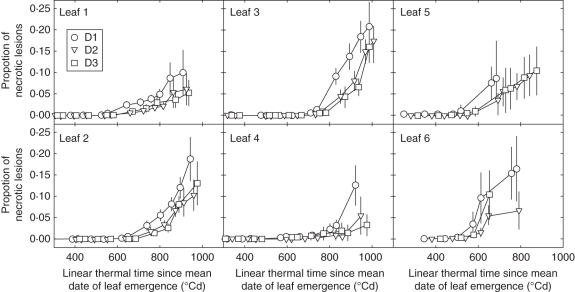
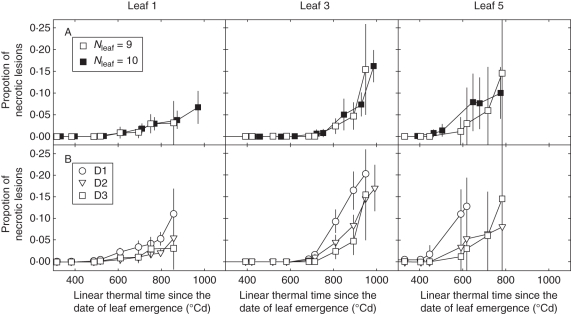
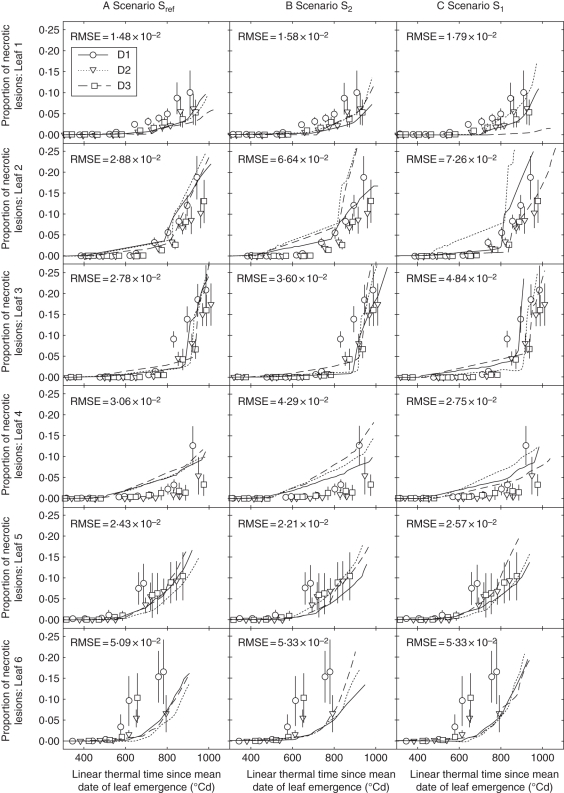
Methods: A field experiment was performed with winter wheat 'Soissons' grown at three contrasted densities. Plant architecture was characterized to parameterize the wheat model, and disease dynamic was monitored to compare with simulations. Three simulation scenarios, differing in the degree of detail with which plant variability of development was represented, were defined.

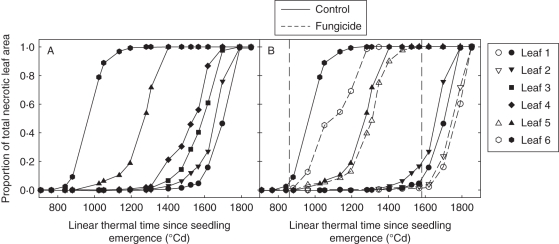
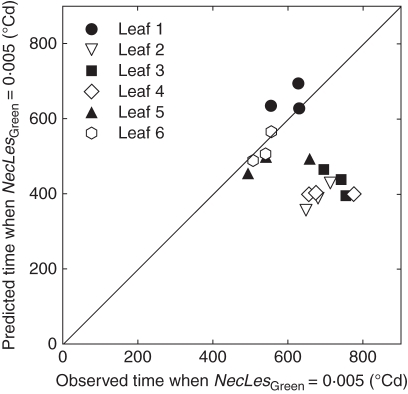
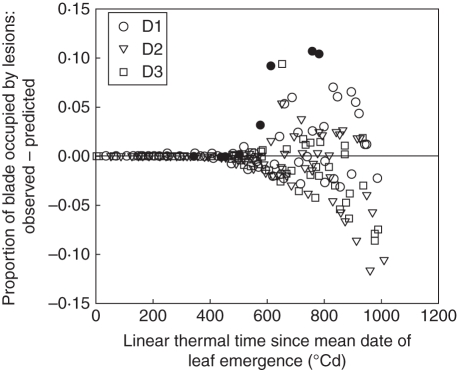
Key results: Despite architectural differences between density treatments, few differences were found in disease progress; only the lower-density treatment resulted in a slightly higher rate of lesion development. Model predictions were consistent with field measurements but did not reproduce the higher rate of lesion progress in the low density. The canopy reconstruction scenario in which inter-plant variability was taken into account yielded the best agreement between measured and simulated epidemics. Simulations performed with the canopy represented by a population of the same average plant deviated strongly from the observations.

Conclusions: It was possible to compare the predicted and measured epidemics on detailed variables, supporting the hypothesis that the approach is able to provide new insights into the processes and plant traits that contribute to the epidemics. On the other hand, the complex and dynamic responses to sowing density made it difficult to test the model precisely and to disentangle the various aspects involved. This could be overcome by comparing more contrasted and/or simpler canopy architectures such as those resulting from quasi-isogenic lines differing by single architectural traits.


Figures

Fig. 1.
Fig. 1.
Scheme of (A) simulated disease variables by Septo3D and (B) measured disease variables on a wheat leaf. NecLesGreen is calculated from model outputs as: (SspoGreen + SemptyGreen)/Sgreen where SspoGreen and SemptyGreen are, respectively, the sporulating and emptied lesions located in the green part of the leaf Sgreen.
Fig. 2.
Fig. 2.
Simulated leaf area index versus compensated thermal time since seedling emergence for the canopy of winter wheat ‘Soissons’ grown at three densities: D1 (59 plants m−2); D2 (160 plants m−2) and D3 (406 plants m−2). Simulations are for the scenario that takes into account plant-to-plant variability of development and number of final phytomers (Sref).
Fig. 3.
Fig. 3.
(A) Mean Haun stage of main stem and (B) number of axes per square metre versus compensated thermal time since seedling emergence; (C) mean blade area and (D) height of leaf collar versus phytomer rank counted from the top. Data are for main stems with ten leaves of winter wheat ‘Soissons’ grown in Grignon in 2008/09 at three densities: D1 (59 plants m−2), D2 (160 plants m−2) and D3 (406 plants m−2). Error bars mark the 95 % confidence intervals when larger than the size of the symbol. The vertical dashed line corresponds to the date of flag leaf ligulation.
Fig. 4.
Fig. 4.
Frequency of classes of plant development. Each class is made of plants quasi-synchronous in development; the x-axis represents the delay (in Haun stage) between a class and the mean calculated over all plants. Measurements were performed the 30 April 2009 for winter wheat ‘Soissons’ grown in Grignon in 2008/09; plants from three density treatments D1 (59 plants m−2); D2 (160 plants m−2) and D3 (406 plants m−2) are pooled together. The line represents the normal distribution of the dispersion of Haun stage used in the parameterization of the scenario Sref.
Fig. 5.
Fig. 5.
(A) Total necrotic leaf area versus linear thermal time since seedling emergence, for leaves 1–6, as indicated, counted from the top of the main stem of wheat plants not treated with fungicide; (B) total necrotic leaf area versus linear thermal time for leaf 1, leaf 2, leaf 5 and leaf 6, as indicated in the key in (A), of main stem from wheat plants not treated (continuous line, closed symbols) and treated (dotted line, open symbols) with fungicide. Data are for winter wheat ‘Soissons’ grown in Grignon in 2008/09 at the intermediate density (D2, 160 plants m−2). Vertical dashed lines correspond to dates of fungicide treatment.
Fig. 6.
Fig. 6.
Dynamic of necrotic lesions of Septoria tritici versus linear thermal time since the mean date of leaf emergence, for main stem leaves 1–6 (counted from the top) of winter wheat ‘Soissons’ grown in Grignon in 2008/09 at three densities: D1 (59 plants m−2); D2 (160 plants m−2) and D3 (406 plants m−2). Error bars mark the 95 % confidence intervals.
Fig. 7.
Fig. 7.
Dynamic of necrotic lesions of Septoria tritici versus linear thermal time since the date of leaf emergence, for leaves 1, 3 and 5 (counted from the top) of the main stem (A) for plants with Nleaf = 9 and Nleaf = 10, as indicated, grown at the high density (D3, 406 plants m−2) and (B) for plants with Nleaf = 10 grown at three densities: D1 (59 plants m−2), D2 (160 plants m−2) and D3 (406 plants m−2), as indicated. Data are for winter wheat ‘Soissons’ grown in Grignon in 2008/09. Error bars mark the 95 % confidence intervals.
Fig. 8.
Fig. 8.
Predicted (lines) and measured (symbols) dynamic of necrotic lesions of Septoria tritici versus linear thermal time since the average date of leaf emergence of leaves 1–6 (counted from the top) for wheat main stem for three scenarios of simulation differing in the degree of architecture description: (A) scenario Sref, (B) scenario S2 and (C) scenario S1. Simulated canopy is represented by the mean plant in scenario S1, by two mean plants differing in their final leaf number in S2 and by plants differing in their final leaf number and stage of development in Sref. Data are for winter wheat ‘Soissons’ grown in Grignon in 2008/09 at three densities, D1 (59 plants m−2), D2 (160 plants m−2) and D3 (406 plants m−2), as indicated. Error bars mark the 95 % confidence intervals.
Fig. 9.
Fig. 9.
Predicted versus observed time when NecLesGreen = 0·005 for leaves 1–6, as indicated, counted from the top for the main stem of winter wheat ‘Soissons’ grown in Grignon in 2008/09 at three densities: D1 (59 plants m−2), D2 (160 plants m−2) and D3 (406 plants m−2). Time is expressed in linear thermal time (°Cd) since the average date of leaf emergence. Predictions are for the scenario that takes into account interplant variability of development (Sref). Each point corresponds to the mean value for a leaf rank in one density treatment.
Fig. 10.
Fig. 10.
Differences between observed and predicted proportions of blade occupied by Septoria tritici necrotic lesions versus linear thermal time since leaf emergence. Predictions are simulated with scenario Sref (that takes into account interplant variability of development) for leaves 1–6 counted from the top of the main stem of winter wheat ‘Soissons’ grown in Grignon in 2008/09 at three densities, D1 (59 plants m−2), D2 (160 plants m−2) and D3 (406 plants m−2), as indicated. Data for leaf 6 at the low density (D1) are shown in closed symbols.

References

    1. Ando K, Grumet R. Evaluation of altered cucumber plant architecture as a means to reduce Phytophthora capsici disease incidence on cucumber fruit. Journal of the American Society for Horticultural Science. 2006;131:491–498.
    1. Ando K, Grumet R, Terpstra K, Kelly JD. Manipulation of plant architecture to enhance crop disease control. CAB Review. Perspectives in Agriculture, Veterinary Science, Nutrition and Natural Resources. 2007 No. 2.
    1. Ansar M, Leitch MH. The effect of agronomic practices on the development of Septoria Leaf Blotch and its subsequent effect on the yield and yield components of wheat. American-Eurasian Journal of Sustainable Agriculture. 2009;3:57–67.
    1. Ansar M, Leitch MH, Jenkins PD, Hayden NJ. Effect of nitrogen fertilizer, crop density and development of Septoria tritici on components of growth and yield of winter wheat in the UK. In: Braun H-J, Altay F, Kronstad WE, Beniwal SOS, McNab A, editors. Wheat: Prospects for Global Improvement. Proceedings of the 5th International Wheat Conference. Heidelberg: Springer; 1996. pp. 270–272. 10–14 June 1996, Ankara, Turkey.
    1. Audsley E, Milne A, Paveley N. A foliar disease model for use in wheat disease management decision support systems. Annals of Applied Biology. 2005;147:161–172.

Publication types