

Remodeling of atrial ATP-sensitive K⁺ channels in a model of salt-induced elevated blood pressure
- PMID: 21724863
- PMCID: PMC3191106
- DOI: 10.1152/ajpheart.00410.2011
Remodeling of atrial ATP-sensitive K⁺ channels in a model of salt-induced elevated blood pressure
Abstract
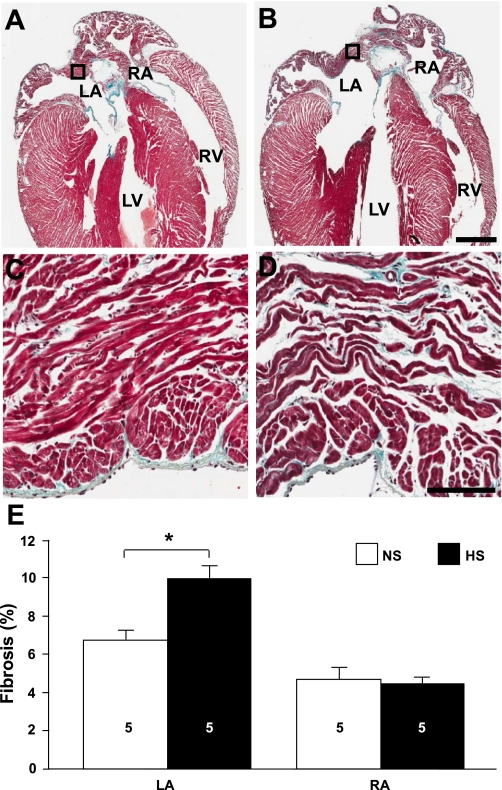
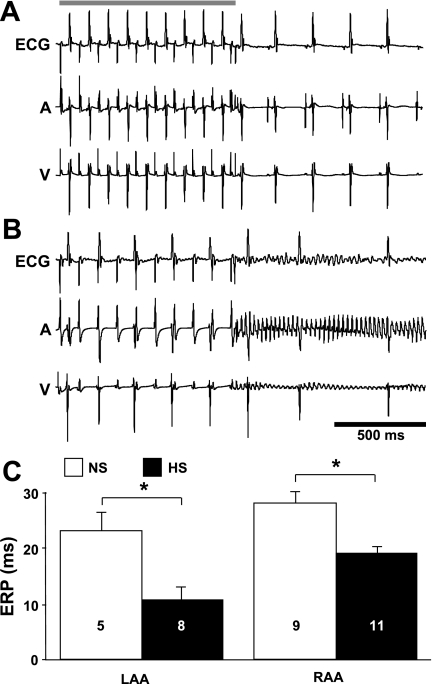
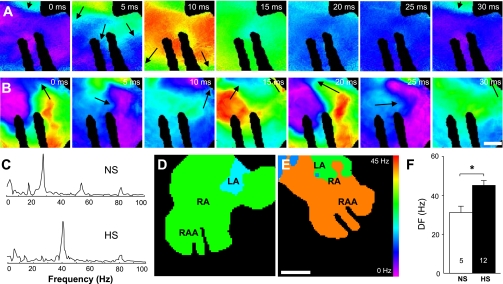
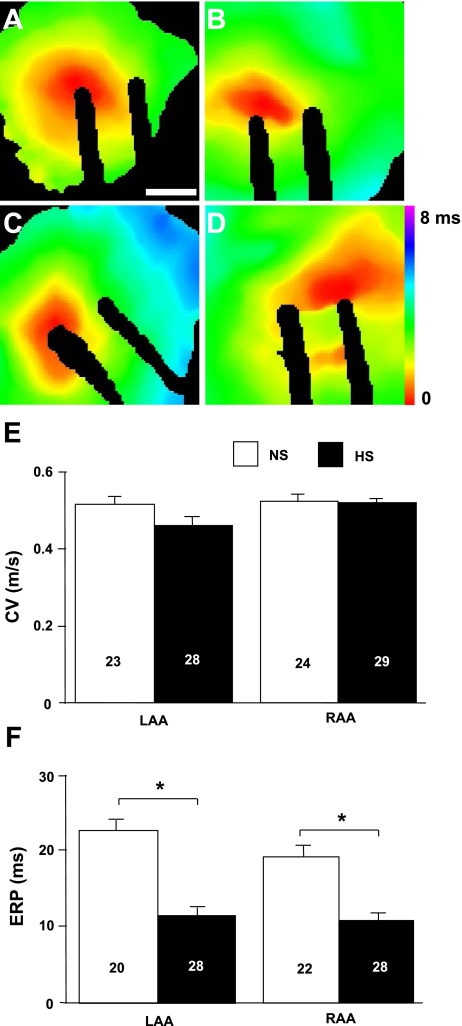
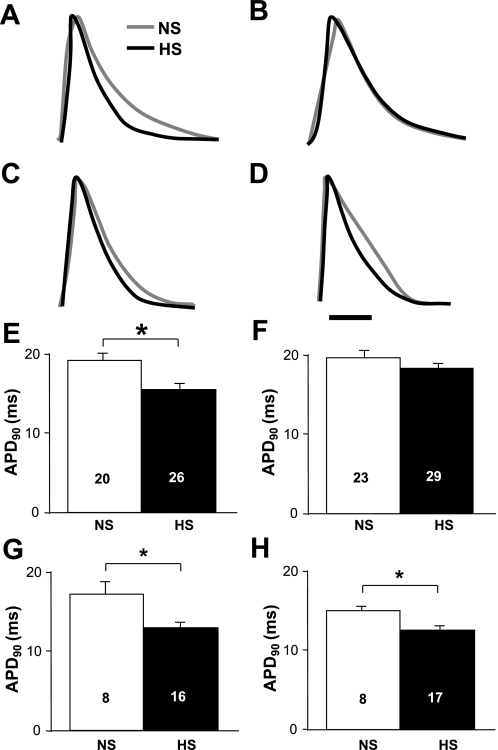
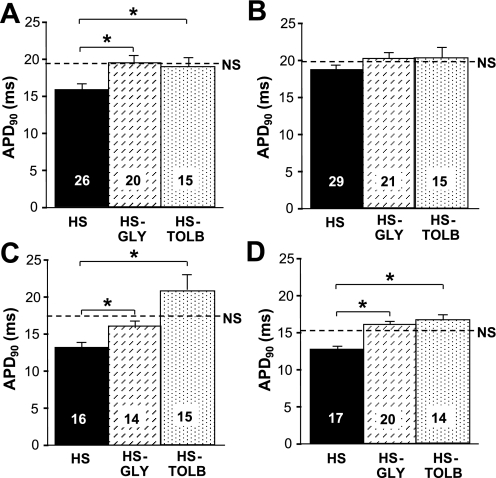
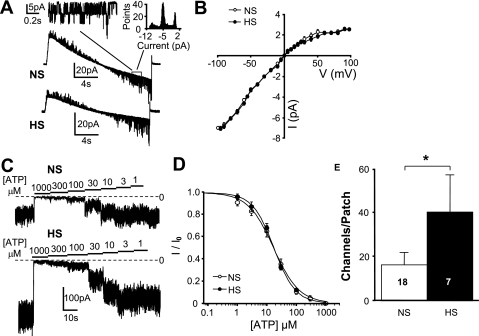
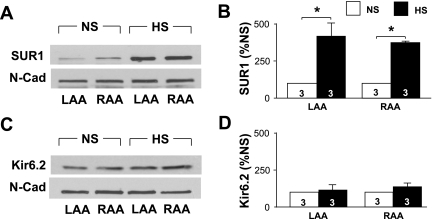
Hypertension is associated with the development of atrial fibrillation; however, the electrophysiological consequences of this condition remain poorly understood. ATP-sensitive K(+) (K(ATP)) channels, which contribute to ventricular arrhythmias, are also expressed in the atria. We hypothesized that salt-induced elevated blood pressure (BP) leads to atrial K(ATP) channel activation and increased arrhythmia inducibility. Elevated BP was induced in mice with a high-salt diet (HS) for 4 wk. High-resolution optical mapping was used to measure atrial arrhythmia inducibility, effective refractory period (ERP), and action potential duration at 90% repolarization (APD(90)). Excised patch clamping was performed to quantify K(ATP) channel properties and density. K(ATP) channel protein expression was also evaluated. Atrial arrhythmia inducibility was 22% higher in HS hearts compared with control hearts. ERP and APD(90) were significantly shorter in the right atrial appendage and left atrial appendage of HS hearts compared with control hearts. Perfusion with 1 μM glibenclamide or 300 μM tolbutamide significantly decreased arrhythmia inducibility and prolonged APD(90) in HS hearts compared with untreated HS hearts. K(ATP) channel density was 156% higher in myocytes isolated from HS animals compared with control animals. Sulfonylurea receptor 1 protein expression was increased in the left atrial appendage and right atrial appendage of HS animals (415% and 372% of NS animals, respectively). In conclusion, K(ATP) channel activation provides a mechanistic link between salt-induced elevated BP and increased atrial arrhythmia inducibility. The findings of this study have important implications for the treatment and prevention of atrial arrhythmias in the setting of hypertensive heart disease and may lead to new therapeutic approaches.
Figures
Similar articles
-
Unique properties of the ATP-sensitive K⁺ channel in the mouse ventricular cardiac conduction system.Circ Arrhythm Electrophysiol. 2011 Dec;4(6):926-35. doi: 10.1161/CIRCEP.111.964643. Epub 2011 Oct 9. Circ Arrhythm Electrophysiol. 2011. PMID: 21984445 Free PMC article.
-
Fibroblast KATP currents modulate myocyte electrophysiology in infarcted hearts.Am J Physiol Heart Circ Physiol. 2013 May;304(9):H1231-9. doi: 10.1152/ajpheart.00878.2012. Epub 2013 Feb 22. Am J Physiol Heart Circ Physiol. 2013. PMID: 23436329 Free PMC article.
-
HMR 1098 is not an SUR isotype specific inhibitor of heterologous or sarcolemmal K ATP channels.J Mol Cell Cardiol. 2011 Mar;50(3):552-60. doi: 10.1016/j.yjmcc.2010.12.011. Epub 2010 Dec 23. J Mol Cell Cardiol. 2011. PMID: 21185839 Free PMC article.
-
Pharmacology of cardiac potassium channels.Adv Pharmacol. 2010;59:93-134. doi: 10.1016/S1054-3589(10)59004-5. Adv Pharmacol. 2010. PMID: 20933200 Review.
-
K(ATP) channel pharmacogenomics: from bench to bedside.Clin Pharmacol Ther. 2008 Feb;83(2):354-7. doi: 10.1038/sj.clpt.6100378. Epub 2007 Oct 24. Clin Pharmacol Ther. 2008. PMID: 17957187 Free PMC article. Review.
Cited by
-
Evaluating the association between dietary salt intake and the risk of atrial fibrillation using Mendelian randomization.Front Nutr. 2023 Apr 6;10:1073626. doi: 10.3389/fnut.2023.1073626. eCollection 2023. Front Nutr. 2023. PMID: 37090783 Free PMC article.
-
Promoter DNA methylation regulates murine SUR1 (Abcc8) and SUR2 (Abcc9) expression in HL-1 cardiomyocytes.PLoS One. 2012;7(7):e41533. doi: 10.1371/journal.pone.0041533. Epub 2012 Jul 23. PLoS One. 2012. PMID: 22844491 Free PMC article.
-
Atrial arrhythmia in ageing spontaneously hypertensive rats: unraveling the substrate in hypertension and ageing.PLoS One. 2013 Aug 27;8(8):e72416. doi: 10.1371/journal.pone.0072416. eCollection 2013. PLoS One. 2013. PMID: 24013508 Free PMC article.
-
Hypoxia Promotes Atrial Tachyarrhythmias via Opening of ATP-Sensitive Potassium Channels.Circ Arrhythm Electrophysiol. 2023 Sep;16(9):e011870. doi: 10.1161/CIRCEP.123.011870. Epub 2023 Aug 30. Circ Arrhythm Electrophysiol. 2023. PMID: 37646176 Free PMC article.
-
Reduction in number of sarcolemmal KATP channels slows cardiac action potential duration shortening under hypoxia.Biochem Biophys Res Commun. 2011 Dec 2;415(4):637-41. doi: 10.1016/j.bbrc.2011.10.125. Epub 2011 Nov 3. Biochem Biophys Res Commun. 2011. PMID: 22079630 Free PMC article.
References
-
- Allessie MA, Konings K, Kirchhof CJ, Wijffels M. Electrophysiologic mechanisms of perpetuation of atrial fibrillation. Am J Cardiol 77: 10A–23A, 1996 - PubMed
-
- Anderson MJ, Viars CS, Czekay S, Cavenee WK, Arden KC. Cloning and characterization of three human forkhead genes that comprise an FKHR-like gene subfamily. Genomics 47: 187–199, 1998 - PubMed
-
- Babenko AP, Gonzalez G, Aguilar-Bryan L, Bryan J. Reconstituted human cardiac KATP channels: functional identity with the native channels from the sarcolemma of human ventricular cells. Circ Res 83: 1132–1143, 1998 - PubMed
-
- Balana B, Dobrev D, Wettwer E, Christ T, Knaut M, Ravens U. Decreased ATP-sensitive K+ current density during chronic human atrial fibrillation. J Mol Cell Cardiol 35: 1399–1405, 2003 - PubMed
Publication types
MeSH terms
Substances
Grants and funding
- R01 HL081336/HL/NHLBI NIH HHS/United States
- P30 CA016087/CA/NCI NIH HHS/United States
- T32 HL098129/HL/NHLBI NIH HHS/United States
- HL-085820/HL/NHLBI NIH HHS/United States
- 1-S10-RR-026681/RR/NCRR NIH HHS/United States
- R01 HL082727/HL/NHLBI NIH HHS/United States
- HL-82727/HL/NHLBI NIH HHS/United States
- 1-T32-HL-098129/HL/NHLBI NIH HHS/United States
- HL-093563/HL/NHLBI NIH HHS/United States
- S10 RR026881/RR/NCRR NIH HHS/United States
- HL-105046/HL/NHLBI NIH HHS/United States
- HL-081336/HL/NHLBI NIH HHS/United States
- HL-076751/HL/NHLBI NIH HHS/United States
LinkOut - more resources
Full Text Sources
Medical
Miscellaneous