

Variation of cone photoreceptor packing density with retinal eccentricity and age
- PMID: 21724911
- PMCID: PMC3183974
- DOI: 10.1167/iovs.11-7199
Variation of cone photoreceptor packing density with retinal eccentricity and age
Abstract
Purpose: To study the variation of cone photoreceptor packing density across the retina in healthy subjects of different ages.
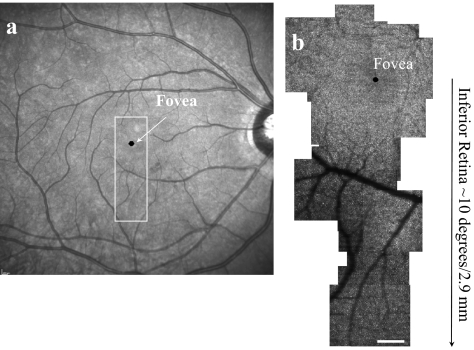
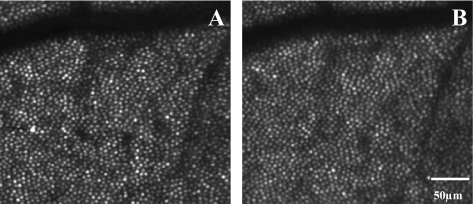
Methods: High-resolution adaptive optics scanning laser ophthalmoscope (AOSLO) systems were used to systematically image the retinas of two groups of subjects of different ages. Ten younger subjects (age range, 22-35 years) and 10 older subjects (age range, 50-65 years) were tested. Strips of cone photoreceptors, approximately 12° × 1.8° long were imaged for each of the four primary retinal meridians: superior, inferior, nasal, and temporal. Cone photoreceptors within the strips were counted, and cone photoreceptor packing density was calculated. Statistical analysis (three-way ANOVA) was used to calculate the interaction for cone photoreceptor packing density between age, meridian, and eccentricity.
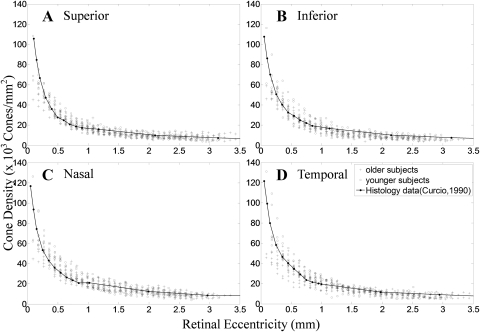
Results: As expected, cone photoreceptor packing density was higher close to the fovea and decreased with increasing retinal eccentricity from 0.18 to 3.5 mm (∼0.6-12°). Older subjects had approximately 75% of the cone density at 0.18 mm (∼0.6°), and this difference decreased rapidly with eccentricity, with the two groups having similar cone photoreceptor packing densities beyond 0.5 mm retinal eccentricity on average.
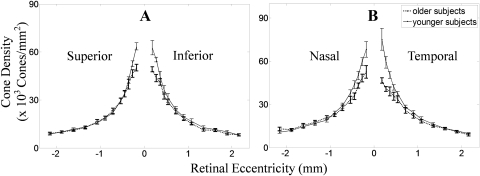
Conclusions: Cone packing density in the living human retina decreases as a function of age within the foveal center with the largest difference being found at our most central measurement site. At all ages, the retina showed meridional difference in cone densities, with cone photoreceptor packing density decreasing faster with increasing eccentricity in the vertical dimensions than in the horizontal dimensions.
Figures


Similar articles
-
Individual variations in human cone photoreceptor packing density: variations with refractive error.Invest Ophthalmol Vis Sci. 2008 Oct;49(10):4679-87. doi: 10.1167/iovs.08-2135. Epub 2008 Jun 14. Invest Ophthalmol Vis Sci. 2008. PMID: 18552378 Free PMC article.
-
A study of factors affecting the human cone photoreceptor density measured by adaptive optics scanning laser ophthalmoscope.Exp Eye Res. 2013 Mar;108:1-9. doi: 10.1016/j.exer.2012.12.011. Epub 2012 Dec 28. Exp Eye Res. 2013. PMID: 23276813 Free PMC article.
-
Visual resolution and cone spacing in the nasal and inferior retina.Ophthalmic Physiol Opt. 2018 Jan;38(1):66-75. doi: 10.1111/opo.12424. Ophthalmic Physiol Opt. 2018. PMID: 29265471
-
Distribution of mid-peripheral cones in emmetropic and myopic subjects using adaptive optics flood illumination camera.Ophthalmic Physiol Opt. 2019 Mar;39(2):94-103. doi: 10.1111/opo.12604. Epub 2019 Jan 29. Ophthalmic Physiol Opt. 2019. PMID: 30697790
-
The organization of the cone photoreceptor mosaic measured in the living human retina.Vision Res. 2017 Mar;132:34-44. doi: 10.1016/j.visres.2016.06.006. Epub 2016 Aug 3. Vision Res. 2017. PMID: 27353225 Free PMC article.
Cited by
-
High-Resolution Imaging of Parafoveal Cones in Different Stages of Diabetic Retinopathy Using Adaptive Optics Fundus Camera.PLoS One. 2016 Apr 8;11(4):e0152788. doi: 10.1371/journal.pone.0152788. eCollection 2016. PLoS One. 2016. PMID: 27057752 Free PMC article.
-
Adaptive optics technology for high-resolution retinal imaging.Sensors (Basel). 2012 Dec 27;13(1):334-66. doi: 10.3390/s130100334. Sensors (Basel). 2012. PMID: 23271600 Free PMC article. Review.
-
Automated identification of cone photoreceptors in adaptive optics optical coherence tomography images using transfer learning.Biomed Opt Express. 2018 Oct 10;9(11):5353-5367. doi: 10.1364/BOE.9.005353. eCollection 2018 Nov 1. Biomed Opt Express. 2018. PMID: 30460133 Free PMC article.
-
Presaccadic attention enhances contrast sensitivity, but not at the upper vertical meridian.iScience. 2022 Feb 1;25(2):103851. doi: 10.1016/j.isci.2022.103851. eCollection 2022 Feb 18. iScience. 2022. PMID: 35198902 Free PMC article.
-
Retinal Photoreceptors and Microvascular Changes in the Assessment of Diabetic Retinopathy Progression: A Two-Year Follow-Up Study.Diagnostics (Basel). 2023 Jul 27;13(15):2513. doi: 10.3390/diagnostics13152513. Diagnostics (Basel). 2023. PMID: 37568876 Free PMC article.
References
-
- Curcio CA, Sloan KR, Jr, Packer O, Hendrickson AE, Kalina RE. Distribution of cones in human and monkey retina: individual variability and radial asymmetry. Science. 1987;236:579–582 - PubMed
-
- Curcio CA, Sloan KR, Kalina RE, Hendrickson AE. Human photoreceptor topography. J Comp Neurol. 1990;292:497–523 - PubMed
-
- Curcio CA, Sloan KR. Packing geometry of human cone photoreceptors: variation with eccentricity and evidence for local anisotropy. Vis Neurosci. 1992;9:169–180 - PubMed
-
- Elsner AE, Berk L, Burns SA, Rosenberg PA. Aging and human cone photopigments. J Opt Soc Am A. 1988;5:2106–2112 - PubMed
Publication types
MeSH terms
Grants and funding
LinkOut - more resources
Full Text Sources
Other Literature Sources
Medical
Research Materials
