

Safety and efficacy of everolimus, a mTOR inhibitor, as single agent in a phase 1/2 study in patients with myelofibrosis
- PMID: 21725052
- PMCID: PMC3365876
- DOI: 10.1182/blood-2011-01-330563
Safety and efficacy of everolimus, a mTOR inhibitor, as single agent in a phase 1/2 study in patients with myelofibrosis
Abstract
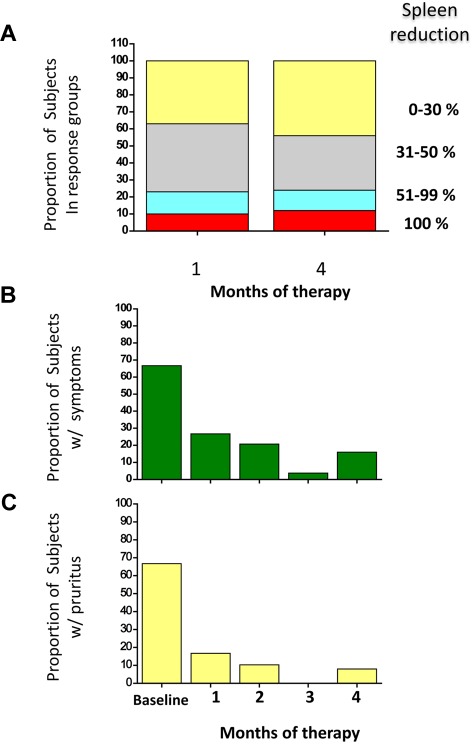
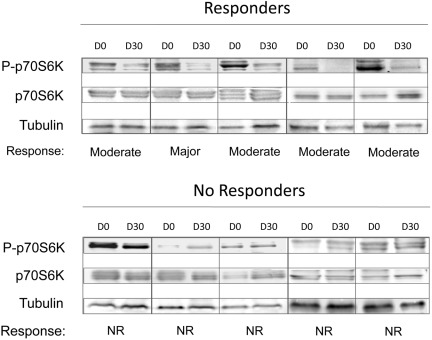
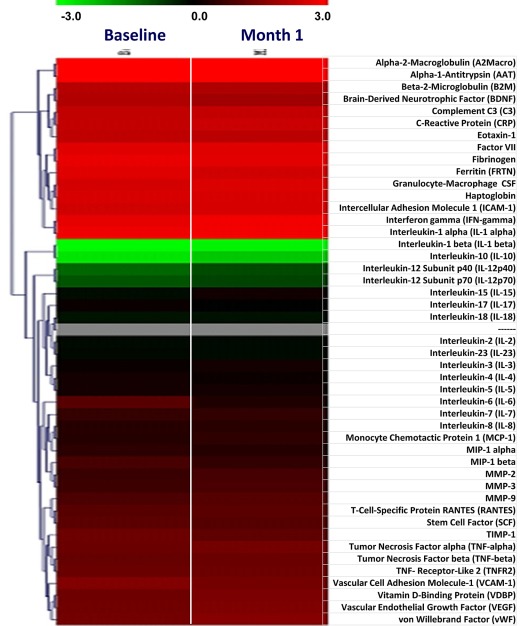
In addition to dysregulated JAK/STAT signaling, activation of the AKT/mTOR pathway occurs in myelofibrosis, a myeloproliferative neoplasm with no approved therapies. We conducted a phase 1/2 study with everolimus, an mTOR inhibitor, in 39 high- or intermediate-risk primary or postpolycythemia vera/postessential thrombocythemia myelofibrosis subjects. Responses were evaluated in 30 patients of phase 2. No dose-limiting toxicity was observed in phase 1 up to 10 mg/d. When this dose was used in phase 2, grade ≥ 3 toxicities were infrequent; the commonest toxicity was grade 1-2 stomatitis. Rapid and sustained splenomegaly reduction of > 50% and > 30% occurred in 20% and 44% of subjects, respectively. A total of 69% and 80% experienced complete resolution of systemic symptoms and pruritus. Response in leukocytosis, anemia, and thrombocytosis occurred in 15%-25%. Clinical responses were not associated with reduced JAK2V617F burden, circulating CD34(+) cells, or cytokine levels, whereas CCDN1 mRNA and phospho-p70S6K level, known targets of mTOR, and WT1 mRNA were identified as possible biomarkers associated with response. Response rate was 60% when European Network for Myelofibrosis criteria were used (8 major, 7 moderate, 3 minor responses) or 23% when IWG-MRT criteria (1 partial response, 6 clinical improvements) were used. These results provide proof-of-concept that targeting mTOR pathway in myelofibrosis may be clinically relevant.
Figures
References
-
- Vannucchi AM, Guglielmelli P, Tefferi A. Advances in understanding and management of myeloproliferative neoplasms. CA Cancer J Clin. 2009;59(3):171–191. - PubMed
-
- Tefferi A. Myelofibrosis with myeloid metaplasia. N Engl J Med. 2000;342(17):1255–1265. - PubMed
-
- Cervantes F, Dupriez B, Pereira A, et al. New prognostic scoring system for primary myelofibrosis based on a study of the International Working Group for Myelofibrosis Research and Treatment. Blood. 2009;113(13):2895–2901. - PubMed
-
- Passamonti F, Cervantes F, Vannucchi AM, et al. A dynamic prognostic model to predict survival in primary myelofibrosis: a study by the IWG-MRT (International Working Group for Myeloproliferative Neoplasms Research and Treatment). Blood. 2010;115:1703–1708. - PubMed
-
- Tefferi A. How I treat myelofibrosis. Blood. 2011;117(13):3494–3504. - PubMed
Publication types
MeSH terms
Substances
LinkOut - more resources
Full Text Sources
Other Literature Sources
Research Materials
Miscellaneous
