. 2011 Jul 3;18(8):950-5.
doi: 10.1038/nsmb.2089.

DNA secondary structures and epigenetic determinants of cancer genome evolution

Affiliations

DNA secondary structures and epigenetic determinants of cancer genome evolution

Subhajyoti De et al. Nat Struct Mol Biol. .

Abstract

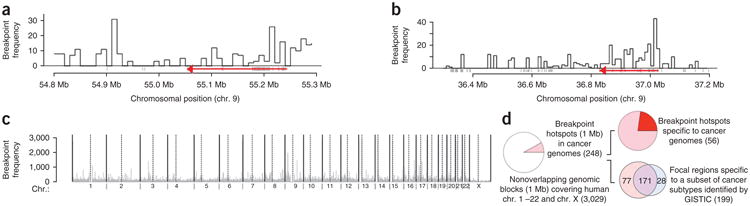
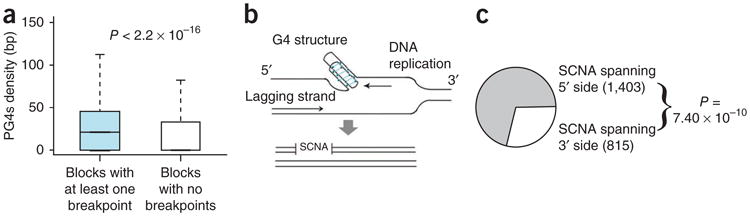
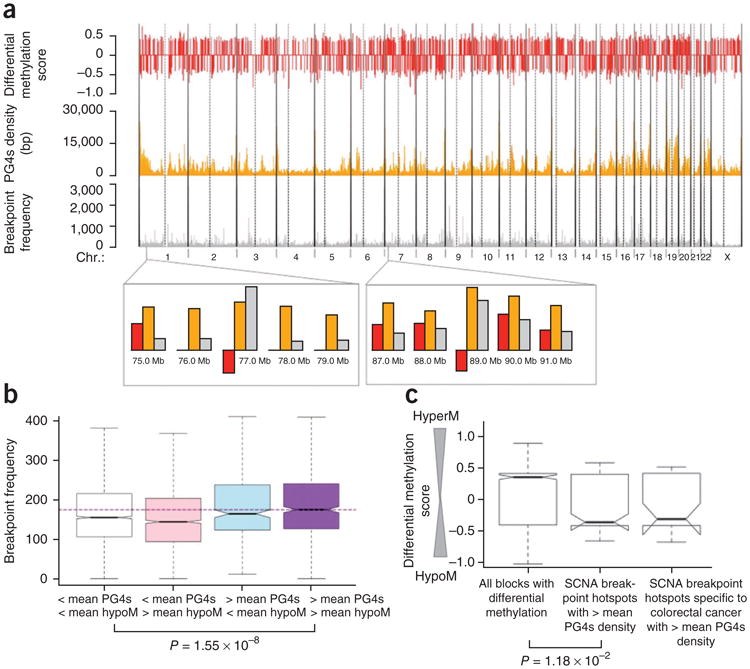
An unstable genome is a hallmark of many cancers. It is unclear, however, whether some mutagenic features driving somatic alterations in cancer are encoded in the genome sequence and whether they can operate in a tissue-specific manner. We performed a genome-wide analysis of 663,446 DNA breakpoints associated with somatic copy-number alterations (SCNAs) from 2,792 cancer samples classified into 26 cancer types. Many SCNA breakpoints are spatially clustered in cancer genomes. We observed a significant enrichment for G-quadruplex sequences (G4s) in the vicinity of SCNA breakpoints and established that SCNAs show a strand bias consistent with G4-mediated structural alterations. Notably, abnormal hypomethylation near G4s-rich regions is a common signature for many SCNA breakpoint hotspots. We propose a mechanistic hypothesis that abnormal hypomethylation in genomic regions enriched for G4s acts as a mutagenic factor driving tissue-specific mutational landscapes in cancer.


Figures

Figure 1
Figure 1
Spatial distribution of breakpoint hotspots in cancer genomes and genomes of healthy human subjects. (a) SCNA breakpoints can occur at high frequencies tens of kilobases away from EGFR (a known cancer gene shared across multiple cancer subtypes), shown in red. The direction of the red arrow shows the direction of transcription of EGFR. (b) SCNA breakpoints can occur at high frequency tens of kilobases away from PAX5 (a known cancer gene specific to acute lymphoblastic leukemia), shown in red. The red arrow shows the direction of transcription of PAX5. (c) SCNA breakpoint densities calculated over 1-Mb nonoverlapping genomic blocks across the human genome. Dotted vertical lines mark centromeres. (d) Summary statistics for SCNA breakpoint hotspots. Frequencies are shown in parentheses.
Figure 2
Figure 2
Association between G-quadruplex– forming sequences and breakpoint hotspots. (a) The distribution of the density (bp) of PG4s in 10-kb genomic blocks that have at least one SCNA breakpoint in cancer is markedly higher than the distribution of PG4s in those genomic blocks that harbor no breakpoints. The whiskers of the box plots represent the range of the PG4s density for the respective groups. (b) A schematic representation of DNA replication near a G4 structure and generation of an SCNA. Arrows indicate the direction of motion of the DNA polymerase. Only the leading strand obstructs the motion of the DNA polymerase and therefore SCNAs are more likely to occur at the 5′ side of G4 structures. (c) Cancer SCNAs with at least two PG4s within 10 kb are significantly likely to occur at the 5′ side of the G4 structures, an observation that is consistent with the hypothesis that these structures inhibit the action of DNA polymerase. Frequencies are shown within parentheses. The pattern is independent of the choice of parameters (see Supplementary Table 5).
Figure 3
Figure 3
Role of G-quadruplex structures in the generation of breakpoint hotspots. (a) Extent of differential methylation in colon cancer relative to normal colon (red), density of G4 sequences (orange) and density of DNA breakpoints in cancer (gray) are shown across the human chromosomes. Vertical dotted lines mark centromeres. A negative value of differential methylation indicates differential hypomethylation. (b) The density of DNA breakpoints in cancer is higher in genomic blocks that have both above-average hypomethylation and above-average PG4s density than that in genomic blocks that do not have above-average representation of either of the factors. The purple horizontal dashed line shows the median breakpoint density corresponding to the rightmost group. The whiskers of the box plots represent the range of the breakpoint frequencies for the respective groups. (c) SCNA breakpoint hotspots with above-average PG4s density are significantly differentially hypomethylated (low differential methylation score) relative to the genome-wide background. SCNA breakpoint hotspots specific to colorectal cancers with above-average PG4s density show a similar trend (P value > 0.05 because there are fewer data points).
Figure 4
Figure 4
A mechanistic hypothesis of epigenetic involvement in the generation of breakpoints in cancer genomes. Genomes in normal tissue are generally hypermethylated and stable. Genome-wide hypomethylation, which occurs stochastically during aging and tumorigenesis, offers a favorable environment in which PG4s can fold into G4 structures in the presence of stabilizing proteins and negative supercoiling. G4 structures are mutagenic and have the potential to generate deletion, insertion or rearrangement events of genetic material on which selection can act to drive cancer evolution. See Discussion for further details.

References

    1. Hanahan D, Weinberg RA. The hallmarks of cancer. Cell. 2000;100:57–70. - PubMed
    1. Beroukhim R, et al. The landscape of somatic copy-number alteration across human cancers. Nature. 2010;463:899–905. - PMC - PubMed
    1. Leary RJ, et al. Integrated analysis of homozygous deletions, focal amplifications, and sequence alterations in breast and colorectal cancers. Proc Natl Acad Sci USA. 2008;105:16224–16229. - PMC - PubMed
    1. Parsons DW, et al. An integrated genomic analysis of human glioblastoma multiforme. Science. 2008;321:1807–1812. - PMC - PubMed
    1. Cancer Genome Atlas Research Network. Comprehensive genomic characterization defines human glioblastoma genes and core pathways. Nature. 2008;455:1061–1068. - PMC - PubMed

Publication types