. 2011 Jul 3;43(8):776-84.
doi: 10.1038/ng.891.

A transition zone complex regulates mammalian ciliogenesis and ciliary membrane composition

Affiliations

A transition zone complex regulates mammalian ciliogenesis and ciliary membrane composition

Francesc R Garcia-Gonzalo et al. Nat Genet. .

Abstract

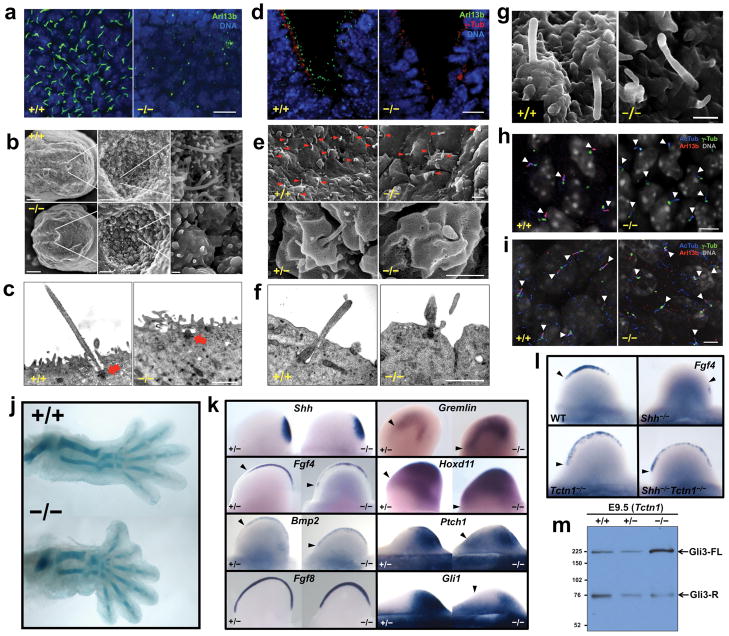
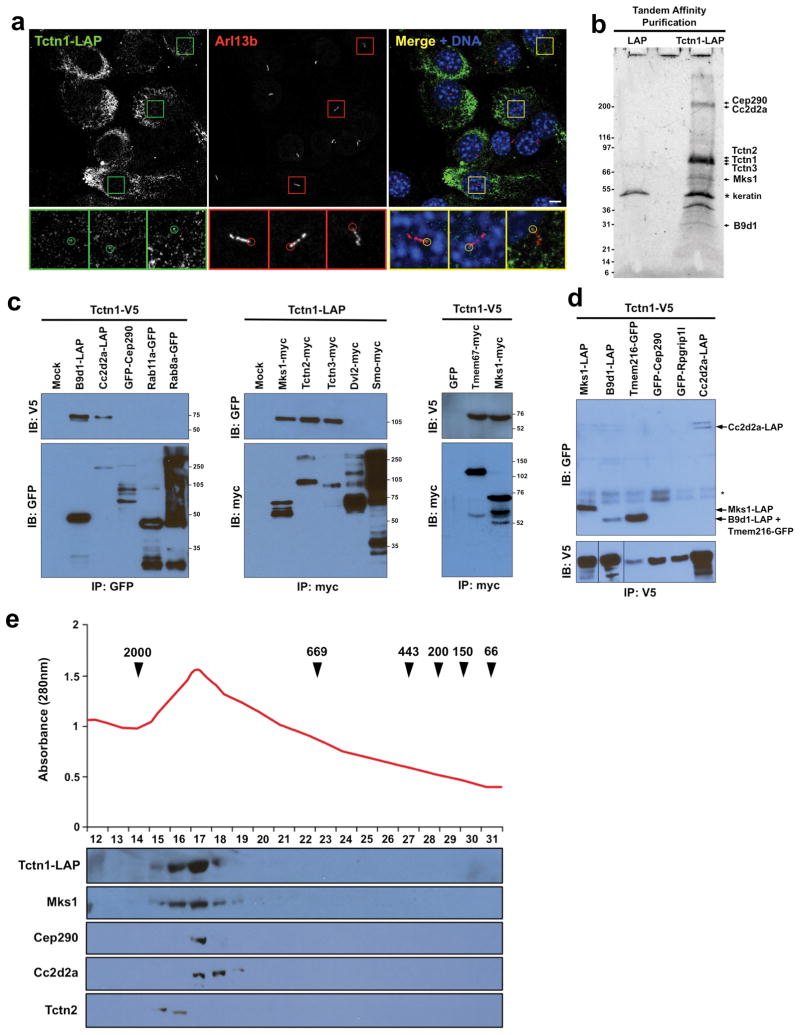
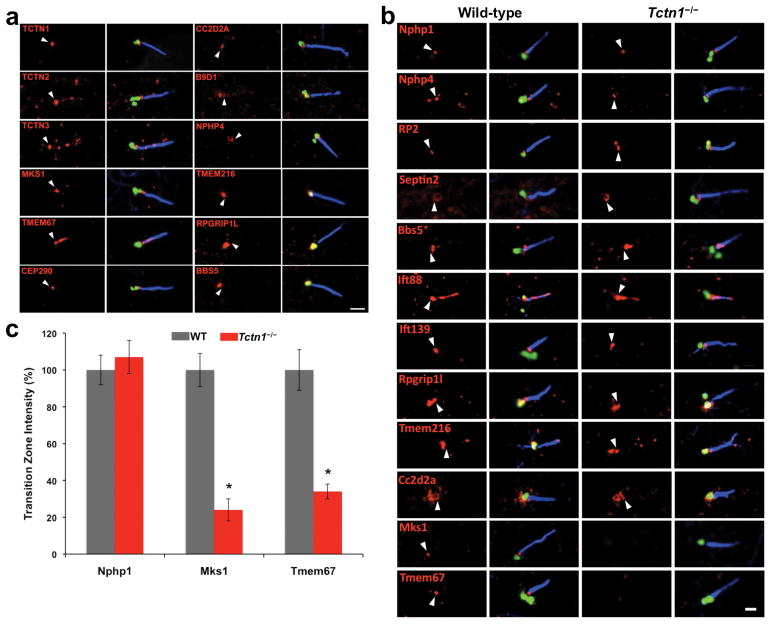
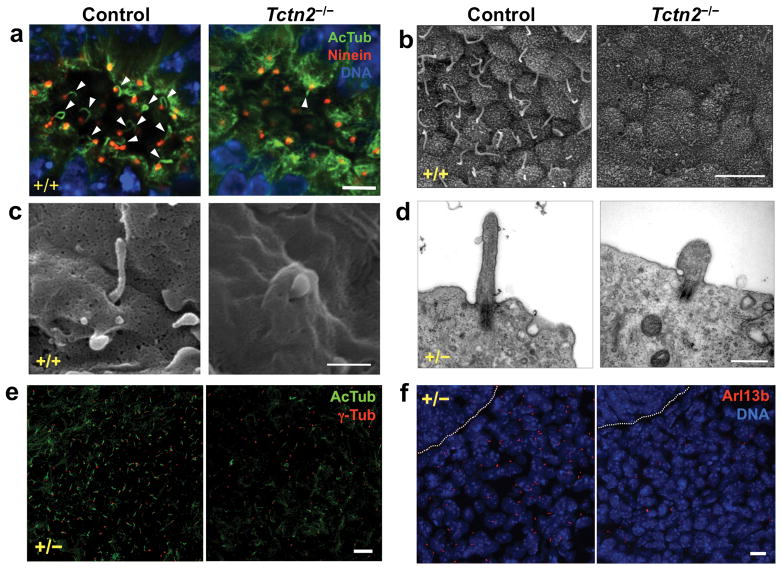
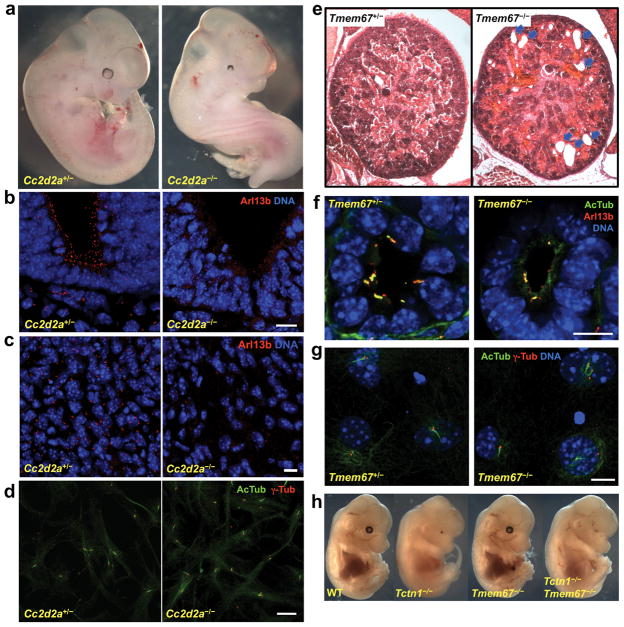
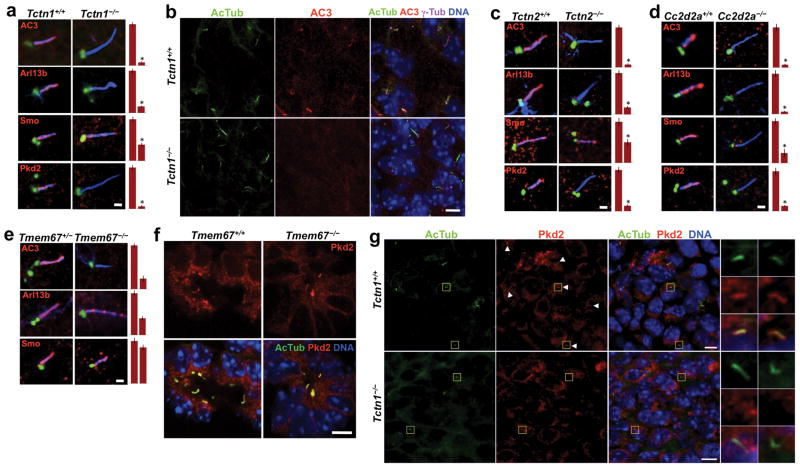
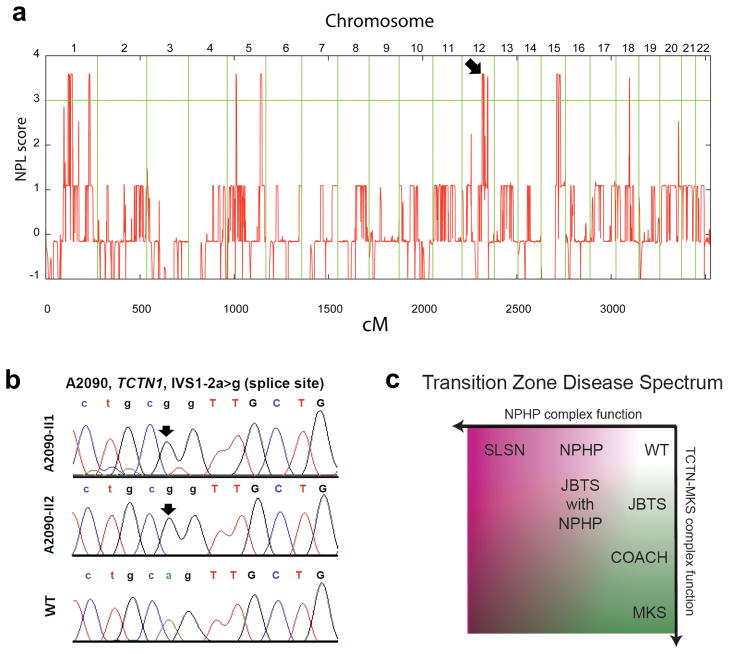
Mutations affecting ciliary components cause ciliopathies. As described here, we investigated Tectonic1 (Tctn1), a regulator of mouse Hedgehog signaling, and found that it is essential for ciliogenesis in some, but not all, tissues. Cell types that do not require Tctn1 for ciliogenesis require it to localize select membrane-associated proteins to the cilium, including Arl13b, AC3, Smoothened and Pkd2. Tctn1 forms a complex with multiple ciliopathy proteins associated with Meckel and Joubert syndromes, including Mks1, Tmem216, Tmem67, Cep290, B9d1, Tctn2 and Cc2d2a. Components of this complex co-localize at the transition zone, a region between the basal body and ciliary axoneme. Like Tctn1, loss of Tctn2, Tmem67 or Cc2d2a causes tissue-specific defects in ciliogenesis and ciliary membrane composition. Consistent with a shared function for complex components, we identified a mutation in TCTN1 that causes Joubert syndrome. Thus, a transition zone complex of Meckel and Joubert syndrome proteins regulates ciliary assembly and trafficking, suggesting that transition zone dysfunction is the cause of these ciliopathies.


Figures

Figure 1
Figure 1. Tctn1 is required for ciliogenesis in a tissue-dependent manner
(a) Wild type and Tctn1−/− E8.5 nodes stained for Arl13b (green) and DNA (DAPI, blue). Scale bar 10μm. (b) SEM of wild type and Tctn1−/− E8.0 nodes. Scale bars are 50μm, 5μm and 0.5μm in left, middle and right panels, respectively. (c) TEM of wild type and Tctn1−/− E8.5 nodes. Arrows indicate basal bodies. Scale bar 1μm. (d) Wild type and Tctn1−/− E10.5 ventral neural tube stained for Arl13b (green), γ-tubulin (red), and DNA (DAPI, blue). Scale bar 10μm. (e) SEM of wild type and Tctn1−/− E9.5 neural tubes. Arrowheads indicate cilia. Scale bars 1μm. (f) TEM of wild type and Tctn1−/− E9.5 neural tubes. Scale bar 1μm. (g) SEM of notochord cilia from wild type and Tctn1−/− E8.0 embryos. Scale bar 1μm. (h) E10.5 perineural mesenchyme sections were stained for AcTub (blue), Arl13b (red), γ-tubulin (green), and DNA (grey). Arl13b localization to Tctn1−/− cilia is reduced. Arrowheads indicate cilia. Scale bar 5μm. (i) E11.5 hindlimb bud mesenchyme sections were stained as in (h). Arl13b is also reduced in Tctn1−/− cilia. Arrowheads indicate cilia. Scale bar 5μm. (j) Alcian blue staining of wild type and Tctn1−/− E14.5 hindlimb cartilage. (k) In situ hybridization of E10.5 or E11.5 hindlimb buds for expression of the indicated genes. (l) In situ hybridization of E10.5 hindlimb buds for Fgf4 expression reveals that Tctn1 is epistatic to Shh. (m) Immunoblot of E9.5 wild type, Tctn1+/− and Tctn1−/− embryo extracts with Gli3 antibodies.
Figure 2
Figure 2. Tctn1 interacts with ciliopathy proteins
(a) NIH-3T3 cells stably expressing Tctn1-LAP were stained for GFP, part of the LAP tag, and the ciliary marker Arl13b. Tctn1-LAP accumulates at the endoplasmic reticulum, and some Tctn1-LAP is seen at the base of some cilia (insets, 3X magnification of indicated regions). Scale bar 5μm. (b) Tctn1-LAP-associated proteins were purified from stable NIH-3T3 cells and separated by SDS-PAGE. SYPRO ruby staining of the gel revealed several major bands, whose identities were elucidated by mass spectrometry and are indicated on the right (a complete list of interactors is found in Table S1). The sizes of molecular weight markers appear on the left. A control purification is also shown. (c) Immunoblot analysis of immunoprecipitates from lysates of COS1 cells transfected with constructs expressing tagged proteins as labeled at top demonstrated that Mks1, Tctn2, Tctn3, B9d1, Cc2d2a and Tmem67 can immunoprecipitate Tctn1. Size markers in kDa are shown on the right of each panel. (d) Reciprocal immunoprecipitation indicated that Tctn1-V5 can associate with tagged coexpressed Mks1, Tmem216, B9d1 and Cc2d2a. The locations of these proteins are indicated on the right. The asterisk indicates a pair of non-specific bands. (e) Tctn1-LAP was purified from NIH-3T3 cells and analyzed by gel filtration chromatography. The eluted fractions were analyzed for total protein amount (top) and by immunoblot for the indicated proteins. Arrowheads indicate the positions of molecular weight markers, in kDa.
Figure 3
Figure 3. Tctn1 and its interactors localize to the ciliary transition zone
(a) hTERT-RPE1 cells were stained for AcTub (blue), the basal body component γ-tubulin (or Ninein in the Cc2d2a panel) (green) and the indicated proteins (red). White arrowheads indicate the position of the transition zone. Note that Tctn1 and its interactors (Tctn2, Tctn3, Mks1, Tmem67, Cep290, Cc2d2a and B9d1) are present at the transition zone, although in some cases not exclusively. Scale bar 1μm. (b) MEFs from wild type and Tctn1−/− embryos were stained as above, except for Septin2 where detyrosinated tubulin, rather than AcTub, is shown in blue. The Tctn1 interactors Mks1, Tmem67 and Cc2d2a localize to the transition zone of wild type MEFs, but Mks1 and Tmem67 fail to localize to the transition zone of Tctn1−/− MEFs. Scale bar 1μm. (c) The intensity of transition zone staining in wild type and Tctn1−/− MEFs was quantified for Nphp1, Mks1 and Tmem67. Data are shown as mean ± SEM. Asterisks denote statistical significance according to unpaired Student’s t-tests (* = p<0.01).
Figure 4
Figure 4. Tctn2, like Tctn1, is essential for ciliogenesis in a tissue dependent manner
(a) Wild type and Tctn2−/− E8.0 nodes stained for AcTub (green), Ninein (red), and DNA (DAPI, blue). Scale bar 5μm. (b) SEM of wild type and Tctn2−/− E8.0 nodes. Scale bar 5μm. (c) SEM of wild type and Tctn2−/− E9.5 neural tubes. Scale bar 0.5μm. (d) TEM of wild type and Tctn2−/− E9.5 neural tubes. Scale bar 0.5μm. (e) Sections of E12.5 hindlimb bud mesenchyme stained for AcTub (green) and γ-tubulin (red). Scale bar 10μm. (f) Wild type and Tctn2−/− E9.5 perineural mesenchyme stained for Arl13b (red) and DNA (DAPI, blue). Dotted line marks neural tube border. Scale bar 10μm.
Figure 5
Figure 5. Tctn1 interactors Cc2d2a and Tmem67 promote ciliogenesis
(a) Control and Cc2d2a−/− E10.5 mouse embryo littermates. (b) Control and Cc2d2a−/− E9.5 ventral neural tube stained for Arl13b (red) and DNA (DAPI, blue). (c) Control and Cc2d2a−/− E9.5 perineural mesenchyme stained for Arl13b (red) and DNA (DAPI, blue). (d) Cc2d2a−/− primary MEFs generate cilia, marked by AcTub (green), with associated basal bodies, marked by γ-tubulin (red). (e) Hematoxylin and eosin staining of E18.5 kidney sections from control and Tmem67−/− embryos. Kidney cysts are visible in the mutant (arrows). (f) Control and Tmem67−/− E18.5 embryonic kidney tubules stained for AcTub (green), Arl13b (red) and DNA (DAPI, blue). Cilia are less abundant in Tmem67−/− tubules, but possess Arl13b. (g) Tmem67−/− primary MEFs generate cilia, as stained for AcTub (green), γ-tubulin (red), and DNA (DAPI, blue). (h) Tctn1 is epistatic to Tmem67. At E14.5, Tmem67−/− mice are indistinguishable from wild type, and Tctn1−/− Tmem67−/− double mutant mice are indistinguishable from Tctn1−/− mice. Scale bars 10μm.
Figure 6
Figure 6. Tctn1 and its interactors control the localization of select ciliary membrane proteins
(a) MEFs from sibling wild type and Tctn1−/− embryos were stained for AcTub (blue), γ-tubulin (green) and the indicated ciliary proteins (red). Quantifications of the ciliary intensity of these proteins are also shown. Data are shown as mean ± SEM. Asterisk denotes statistical significance according to unpaired Student’s t-tests (* = p<0.01). Scale bar 1μm. (b) E14.5 palatal sections were stained for AcTub, AC3, γ-tubulin and DNA. Ciliary localization of AC3 was evident in wild type embryos, but not in Tctn1−/− embryos. Scale bar 5μm. (c) MEFs from sibling wild type and Tctn2−/− embryos were stained and analyzed as in (a). Scale bar 1μm. (d) MEFs from sibling wild type and Cc2d2a−/− embryos were stained and analyzed as in (a). Scale bar 1μm. (e) MEFs from sibling Tmem67+/− and Tmem67−/− embryos were stained and analyzed as in (a). Scale bar 1μm. (f) E18.5 kidney sections were stained for AcTub, Pkd2 and DNA. Ciliary localization of Pkd2 was evident in both wild type and Tmem67−/− kidney tubules. Scale bar 10μm. (g) E14.5 perineural mesenchyme was stained for AcTub, Pkd2 and DNA. Ciliary localization of Pkd2 was evident in wild type embryos, but not in Tctn1−/− embryos. Boxed regions have been magnified 4X. Scale bars 5μm.
Figure 7
Figure 7. A human TCTN1 mutation is a cause of Joubert syndrome
(a) Non-parametric logarithmic odds score (NPL score) profile across the genomes of two sisters with JBTS of consanguineous family A2090. SNP positions on human chromosomes are concatenated from p-ter (left) to q-ter (right) on the x-axis. Genetic distance is given in cM. Maximum NPL peaks signify regions of homozygosity by descent. A maximum NPL peak on chromosome 12q (arrow) contains the candidate locus TCTN1. (b) A homozygous mutation (IVS1–2a>g) of the intron 1 obligatory splice acceptor consensus is present in both siblings (II-1 and II-2) with JBTS of family A2090, but is absent from a healthy control individual (WT). (c) A model of how transition zone dysfunction results in human disease. Progressive compromise of TCTN complex function (y-axis) results in JBTS, COACH and MKS. Progressive compromise of NPHP complex function (x-axis) results in NPHP and SLSN. Mutations that compromise the function of both the TCTN and NPHP complexes may result in syndromes with elements of both, such as JBTS with NPHP.

Comment in

References

    1. Hodges ME, Scheumann N, Wickstead B, Langdale JA, Gull K. Reconstructing the evolutionary history of the centriole from protein components. J Cell Sci. 2010;123:407–413. - PMC - PubMed
    1. Goetz SC, Anderson KV. The primary cilium: a signalling centre during vertebrate development. Nat Rev Genet. 2010;11:331–344. - PMC - PubMed
    1. Sorokin S. Centrioles and the formation of rudimentary cilia by fibroblasts and smooth muscle cells. J Cell Biol. 1962;15:363–377. - PMC - PubMed
    1. Nachury MV, Seeley ES, Jin H. Trafficking to the Ciliary Membrane: How to Get Across the Periciliary Diffusion Barrier? Annu Rev Cell Dev Biol. 2010;26:59–87. - PMC - PubMed
    1. Sang L, et al. Mapping the NPHP-JBTS-MKS Protein Network Reveals Ciliopathy Disease Genes and Pathways. Cell. 2011;145:513–528. - PMC - PubMed

Publication types

MeSH terms

Supplementary concepts