

Multiple factors insulate Msh2-Msh6 mismatch repair activity from defects in Msh2 domain I
- PMID: 21726567
- PMCID: PMC3163898
- DOI: 10.1016/j.jmb.2011.06.030
Multiple factors insulate Msh2-Msh6 mismatch repair activity from defects in Msh2 domain I
Abstract
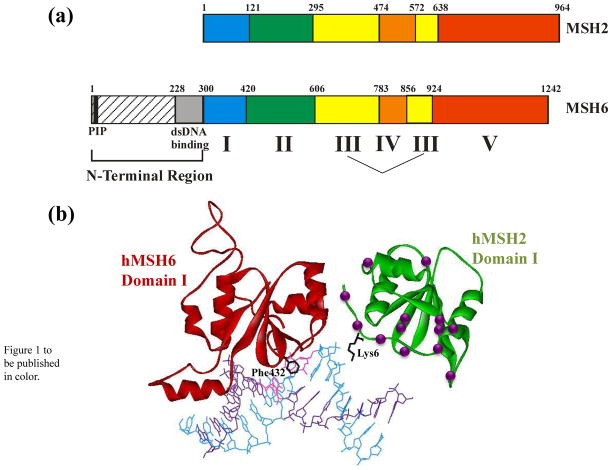
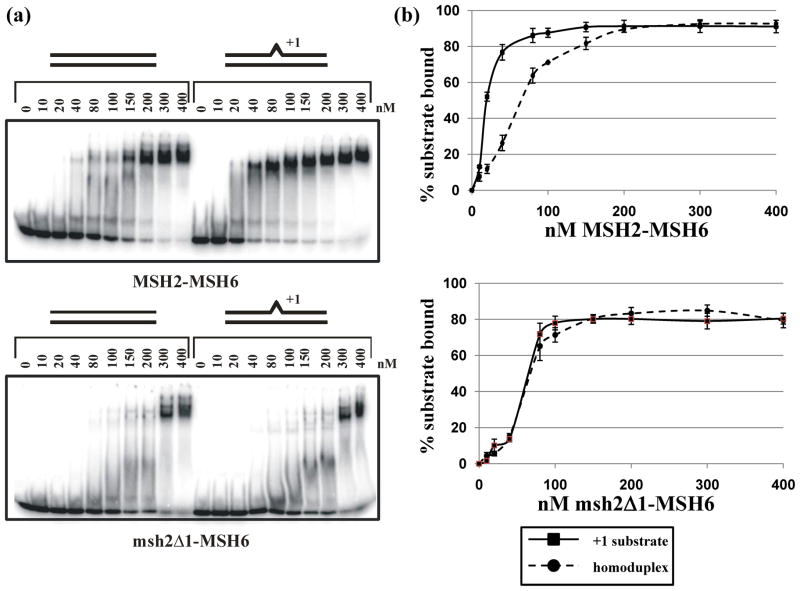
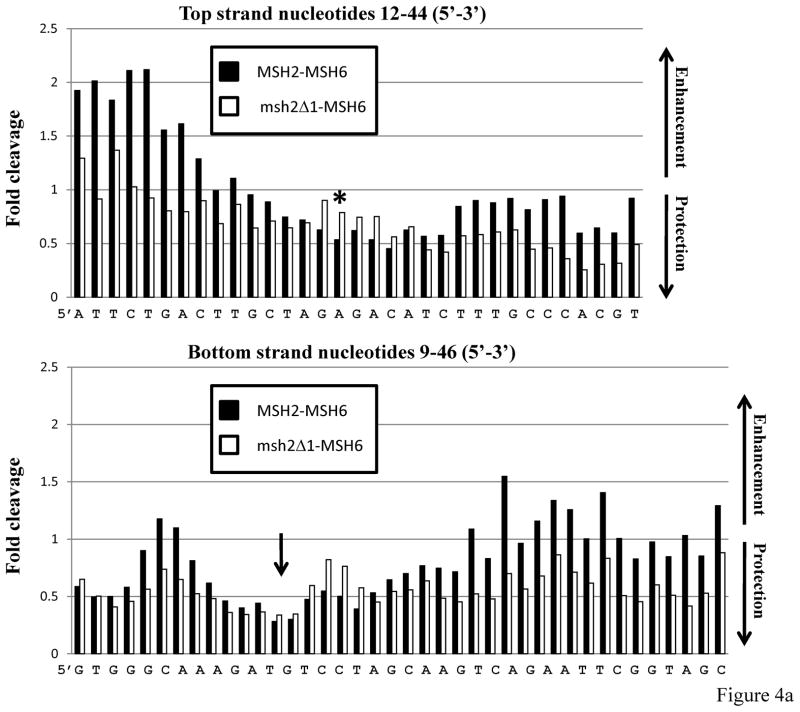
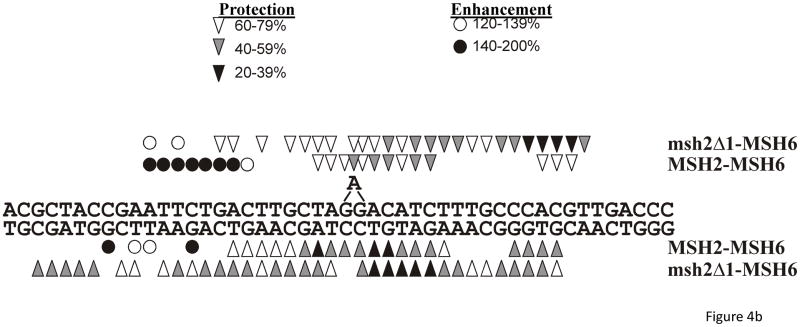
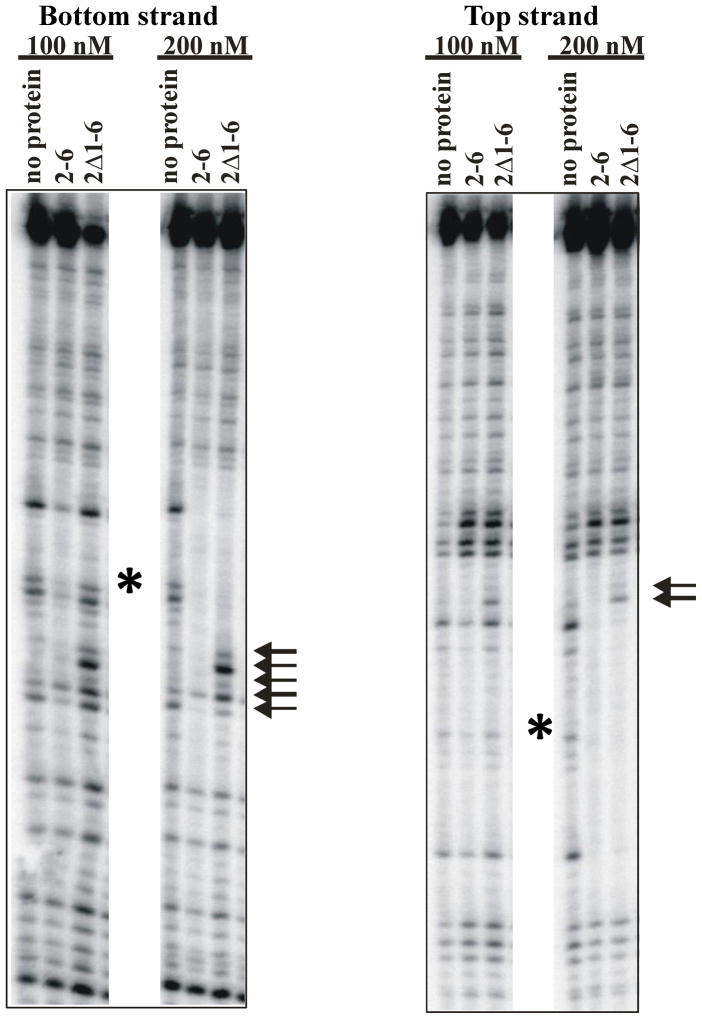
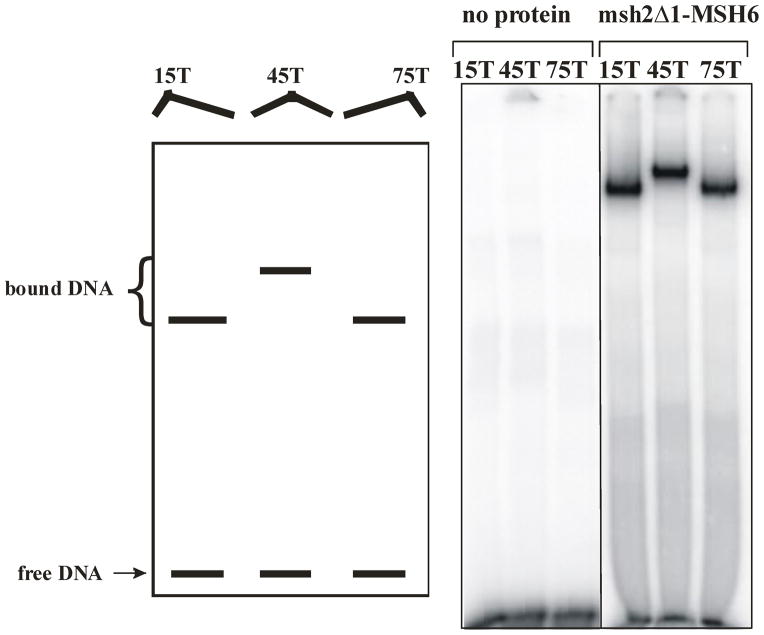
DNA mismatch repair (MMR) is a highly conserved mutation avoidance mechanism that corrects DNA polymerase misincorporation errors. In initial steps in MMR, Msh2-Msh6 binds mispairs and small insertion/deletion loops, and Msh2-Msh3 binds larger insertion/deletion loops. The msh2Δ1 mutation, which deletes the conserved DNA-binding domain I of Msh2, does not dramatically affect Msh2-Msh6-dependent repair. In contrast, msh2Δ1 mutants show strong defects in Msh2-Msh3 functions. Interestingly, several mutations identified in patients with hereditary non-polyposis colorectal cancer map to domain I of Msh2; none have been found in MSH3. To understand the role of Msh2 domain I in MMR, we examined the consequences of combining the msh2Δ1 mutation with mutations in two distinct regions of MSH6 and those that increase cellular mutational load (pol3-01 and rad27). These experiments reveal msh2Δ1-specific phenotypes in Msh2-Msh6 repair, with significant effects on mutation rates. In vitro assays demonstrate that msh2Δ1-Msh6 DNA binding is less specific for DNA mismatches and produces an altered footprint on a mismatch DNA substrate. Together, these results provide evidence that, in vivo, multiple factors insulate MMR from defects in domain I of Msh2 and provide insights into how mutations in Msh2 domain I may cause hereditary non-polyposis colorectal cancer.
Copyright © 2011 Elsevier Ltd. All rights reserved.
Figures
Similar articles
-
Saccharomyces cerevisiae MSH2-MSH3 and MSH2-MSH6 complexes display distinct requirements for DNA binding domain I in mismatch recognition.J Mol Biol. 2007 Feb 9;366(1):53-66. doi: 10.1016/j.jmb.2006.10.099. Epub 2006 Nov 3. J Mol Biol. 2007. PMID: 17157869 Free PMC article.
-
Mispair-specific recruitment of the Mlh1-Pms1 complex identifies repair substrates of the Saccharomyces cerevisiae Msh2-Msh3 complex.J Biol Chem. 2014 Mar 28;289(13):9352-64. doi: 10.1074/jbc.M114.552190. Epub 2014 Feb 18. J Biol Chem. 2014. PMID: 24550389 Free PMC article.
-
Msh2 separation of function mutations confer defects in the initiation steps of mismatch repair.J Mol Biol. 2003 Aug 1;331(1):123-38. doi: 10.1016/s0022-2836(03)00694-6. J Mol Biol. 2003. PMID: 12875840
-
Structural, molecular and cellular functions of MSH2 and MSH6 during DNA mismatch repair, damage signaling and other noncanonical activities.Mutat Res. 2013 Mar-Apr;743-744:53-66. doi: 10.1016/j.mrfmmm.2012.12.008. Epub 2013 Feb 4. Mutat Res. 2013. PMID: 23391514 Free PMC article. Review.
-
DNA mismatch repair: molecular mechanism, cancer, and ageing.Mech Ageing Dev. 2008 Jul-Aug;129(7-8):391-407. doi: 10.1016/j.mad.2008.02.012. Epub 2008 Mar 4. Mech Ageing Dev. 2008. PMID: 18406444 Free PMC article. Review.
Cited by
-
Incomplete Segregation of MSH6 Frameshift Variants with Phenotype of Lynch Syndrome.Int J Mol Sci. 2017 May 6;18(5):999. doi: 10.3390/ijms18050999. Int J Mol Sci. 2017. PMID: 28481244 Free PMC article.
-
Eukaryotic Mismatch Repair in Relation to DNA Replication.Annu Rev Genet. 2015;49:291-313. doi: 10.1146/annurev-genet-112414-054722. Annu Rev Genet. 2015. PMID: 26436461 Free PMC article. Review.
-
MSH3 polymorphisms and protein levels affect CAG repeat instability in Huntington's disease mice.PLoS Genet. 2013;9(2):e1003280. doi: 10.1371/journal.pgen.1003280. Epub 2013 Feb 28. PLoS Genet. 2013. PMID: 23468640 Free PMC article.
-
Elevated MSH2 MSH3 expression interferes with DNA metabolism in vivo.Nucleic Acids Res. 2023 Dec 11;51(22):12185-12206. doi: 10.1093/nar/gkad934. Nucleic Acids Res. 2023. PMID: 37930834 Free PMC article.
-
Understanding how mismatch repair proteins participate in the repair/anti-recombination decision.FEMS Yeast Res. 2016 Sep;16(6):fow071. doi: 10.1093/femsyr/fow071. Epub 2016 Aug 28. FEMS Yeast Res. 2016. PMID: 27573382 Free PMC article.
References
-
- Kunkel TA, Erie DA. DNA mismatch repair. Annu Rev Biochem. 2005;74:681–710. - PubMed
-
- Jiricny J. The multifaceted mismatch-repair system. Nat Rev Mol Cell Biol. 2006;7:335–346. - PubMed
-
- Li GM. Mechanisms and functions of DNA mismatch repair. Cell Res. 2008;18:85–98. - PubMed
-
- Modrich P, Lahue R. Mismatch repair in replication fidelity, genetic recombination, and cancer biology. Annu Rev Biochem. 1996;65:101–133. - PubMed
-
- Peltomaki P. Lynch syndrome genes. Fam Cancer. 2005;4:227–232. - PubMed
Publication types
MeSH terms
Substances
Grants and funding
LinkOut - more resources
Full Text Sources
Molecular Biology Databases
Miscellaneous
