Comparative Study
. 2011 Jul 8;43(1):72-84.
doi: 10.1016/j.molcel.2011.05.013.

Opposing effects of glutamine and asparagine govern prion formation by intrinsically disordered proteins

Affiliations
Comparative Study

Opposing effects of glutamine and asparagine govern prion formation by intrinsically disordered proteins

Randal Halfmann et al. Mol Cell. .

Abstract

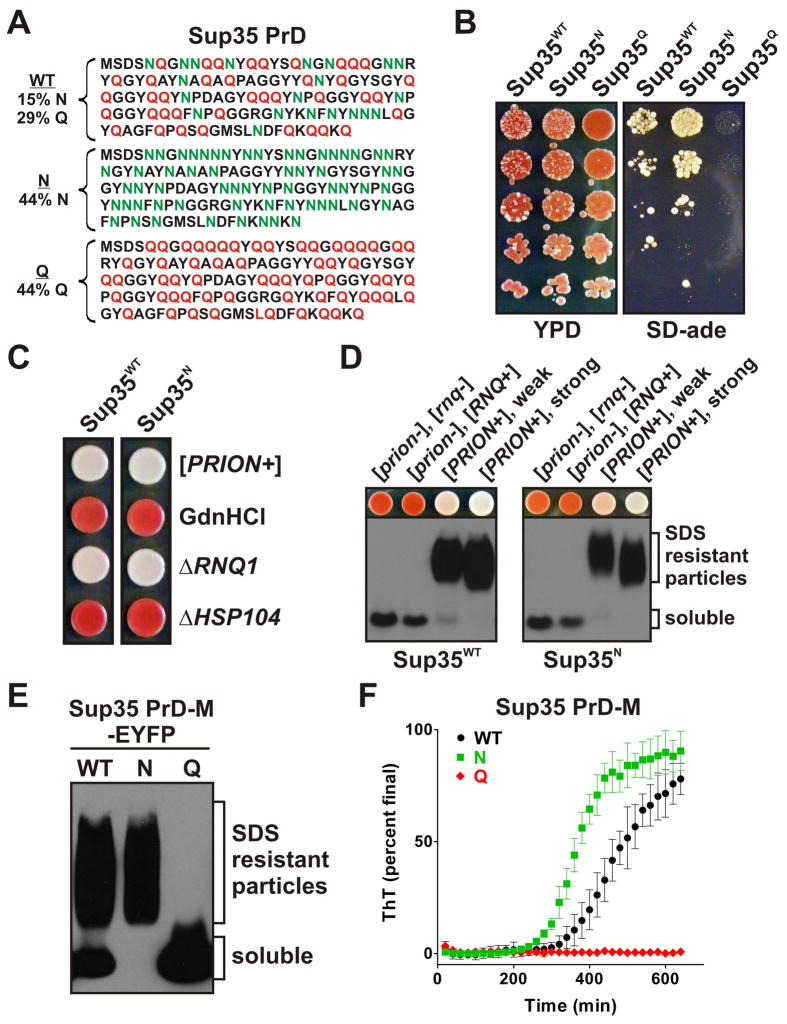
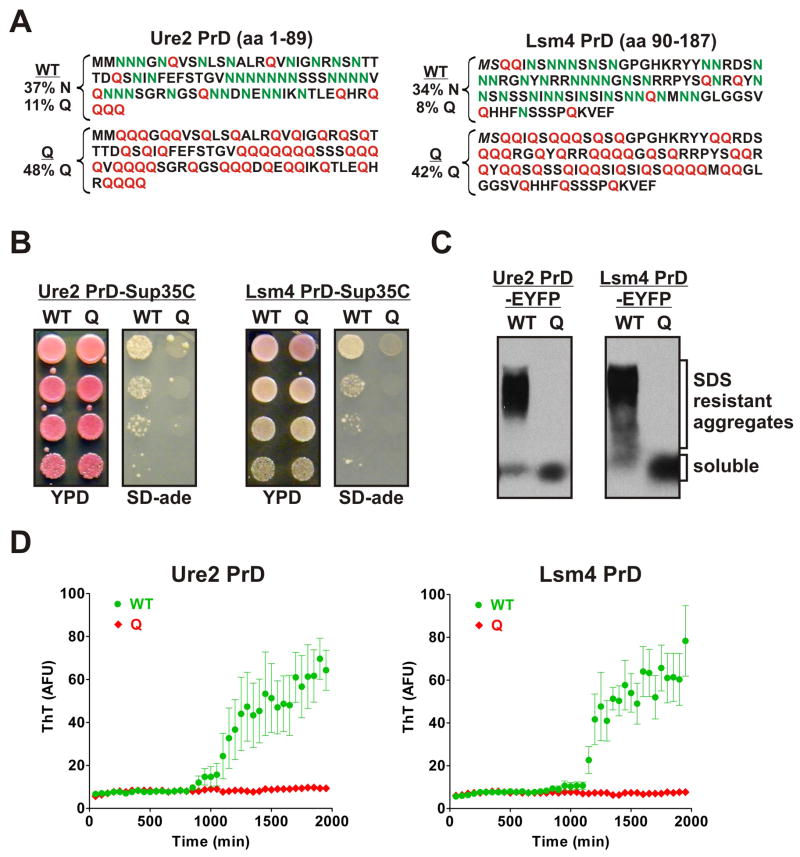
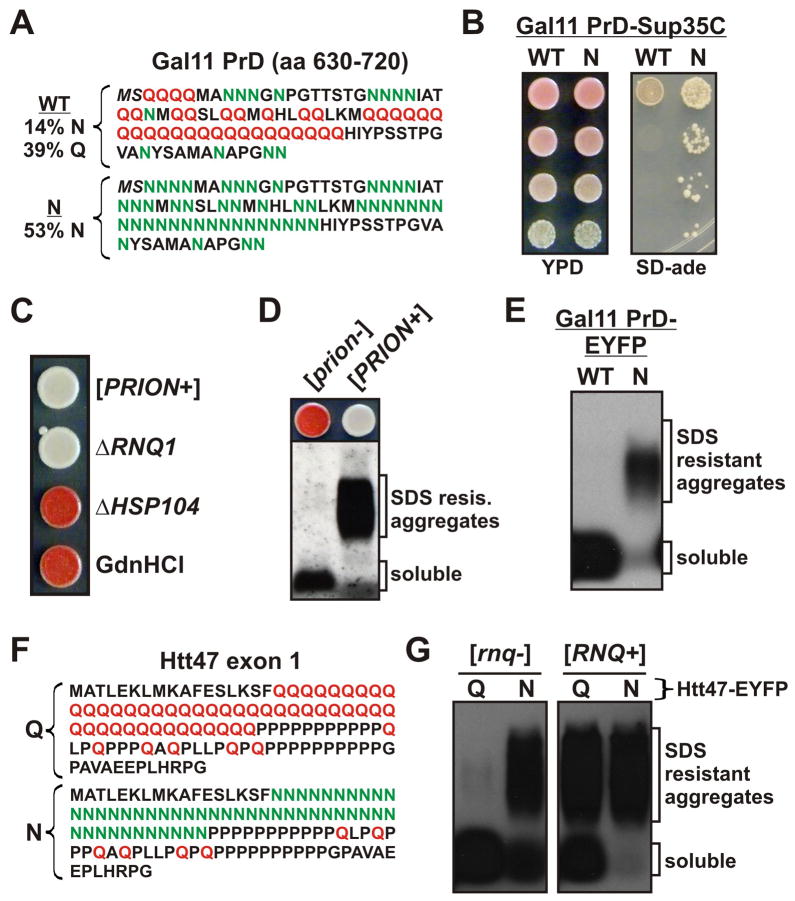
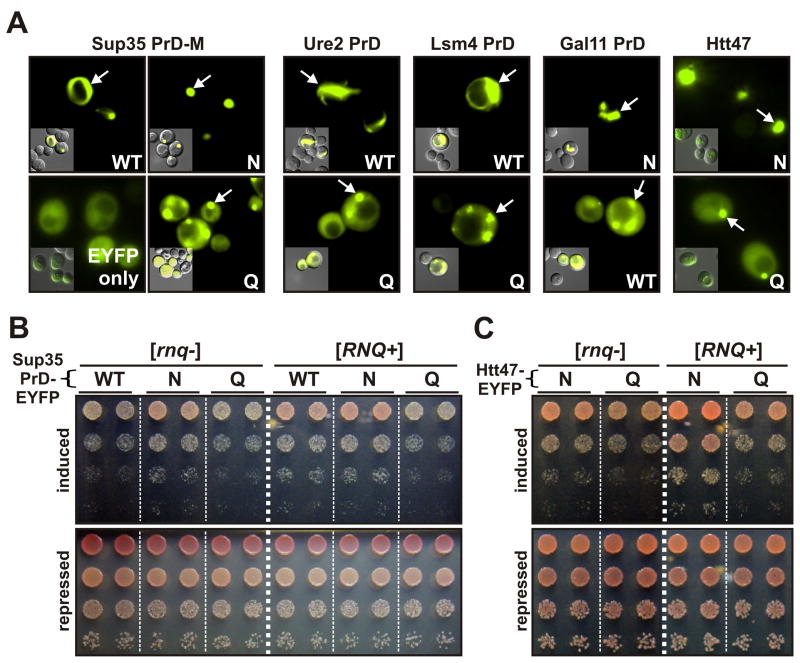
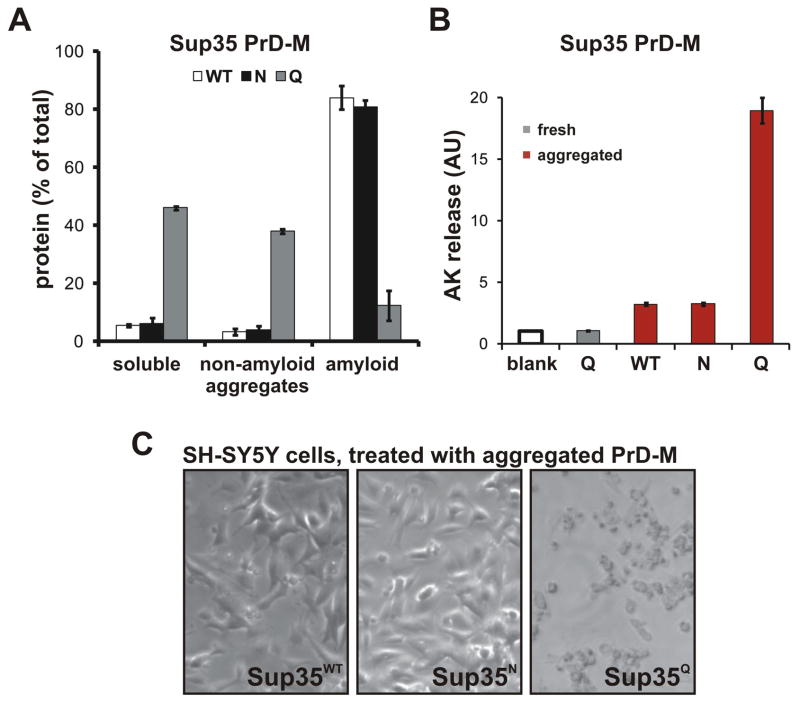
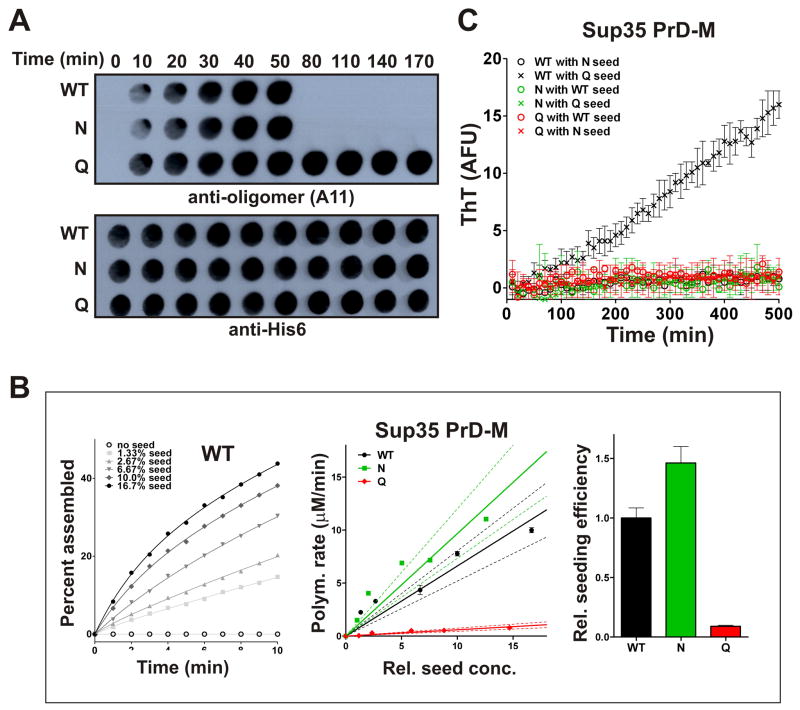
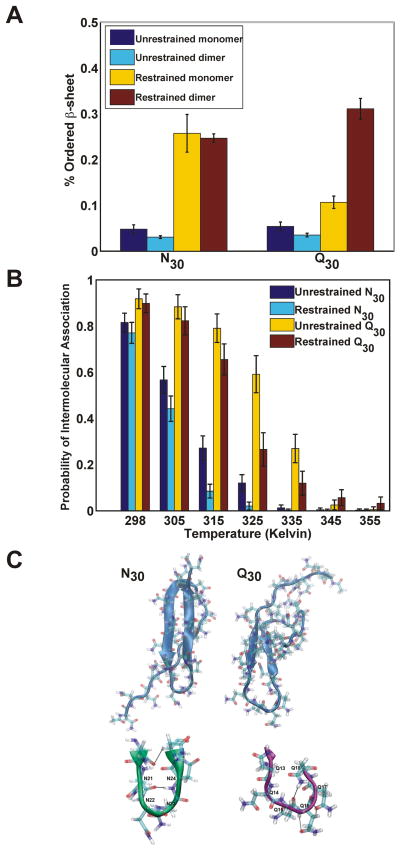
Sequences rich in glutamine (Q) and asparagine (N) residues often fail to fold at the monomer level. This, coupled to their unusual hydrogen-bonding abilities, provides the driving force to switch between disordered monomers and amyloids. Such transitions govern processes as diverse as human protein-folding diseases, bacterial biofilm assembly, and the inheritance of yeast prions (protein-based genetic elements). A systematic survey of prion-forming domains suggested that Q and N residues have distinct effects on amyloid formation. Here, we use cell biological, biochemical, and computational techniques to compare Q/N-rich protein variants, replacing Ns with Qs and Qs with Ns. We find that the two residues have strong and opposing effects: N richness promotes assembly of benign self-templating amyloids; Q richness promotes formation of toxic nonamyloid conformers. Molecular simulations focusing on intrinsic folding differences between Qs and Ns suggest that their different behaviors are due to the enhanced turn-forming propensity of Ns over Qs.


Figures

Figure 1
Figure 1. Prion formation by Sup35 is promoted by Ns, inhibited by Qs
(A) WT sequence of the Sup35 PrD (top), and Q and N replacement variants. (B) Yeast strains expressing Sup35 variants spotted as 5-fold serial dilutions onto YPD (nonselective) or SD-ade (prion-selective) plates. Prion states were induced by the over-expression of PrD-M-EYFP fusions for 24 hours prior to plating. (C) The N-substituted variant of Sup35 can form a prion state that is equivalent to that of WT. White Ade+ Sup35N cells were isolated and passaged on plates containing 5 mM GdnHCl (“GdnHCl”) or transformed with gene-specific knockout cassettes to delete RNQ1 (“ΔRNQ1”) or HSP104 (“ΔHSP104”). All presumptive prion strains were curable and lost the prion state upon deletion of HSP104. A representative [PRION+] strain of Sup35N (right) is compared to a strong [PRION+] strain of Sup35WT (left). (D) Sup35N can form different conformational variants that are equivalent to those of Sup35WT. Colonies with weak and strong Ade+ phenotypes were isolated (Figure S1G). SDS-resistant aggregates were detected by SDD-AGE and immunoblotting with a Sup35C-specific antibody. (E) Variant Sup35 PrD-M-EYFP fusions were expressed for 24 hours in [RNQ+] cells prior to SDD-AGE analysis. PrD-M-EYFP was detected with a GFP-specific antibody. (F) Sup35 PrD-M-His7 variants were purified under denaturing conditions and then diluted to 5 μM in assembly buffer. Reactions were agitated for 10 sec every 2 min in the presence of non-binding plastic beads. Amyloid formation was monitored by ThT fluorescence. Data were normalized by the final values achieved for each variant after extended incubations. Data represent means +/− SEM. See also Figure S1.
Figure 2
Figure 2. Replacing Ns with Qs eliminates prion-formation by N-rich PrDs
(A) The sequences of the Ure2 and Lsm4 PrDs (top), along with the Q variants. (B) Yeast strains containing variant Ure2 and Lsm4 PrDs fused to Sup35C were spotted to YPD and SD-ade plates as in Figure 1B. Prion states were induced by over-expression of PrD-EYFP fusions for 24 hours prior to plating. Representative Ade+ colonies for Ure2WT and Lsm4WT (but not the few Ade+ colonies observed for Ure2Q) showed SDS-resistant aggregates by SDD-AGE and were eliminated by growth on GdnHCl (not shown). (C) Variant Ure2 and Lsm4 PrD-EYFP fusions were expressed for 24 hrs in [RNQ+] cells prior to SDD-AGE analysis as in Figure 1E. (D) Purified denatured variants of Ure2 and Lsm4 PrD-His7 were diluted to 20 μM or 5uM, respectively, in assembly buffer. Reactions were agitated for 10 sec every 2 min in the absence of beads. Amyloid formation was monitored by ThT fluorescence. Data represent means +/− SEM. See also Figure S2.
Figure 3
Figure 3. Replacing Qs with Ns increases amyloid and prion formation by Q-rich proteins
(A) WT and N variants of the putative PrD of Gal11, residues 630–720. (B) Yeast strains containing variants of the Gal11 PrD fused to Sup35C were spotted to YPD and SD-ade plates as in Figure 1B. Prion states were induced by over-expression of PrD-EYFP fusions for 24 hours prior to plating. (C–D) Gal11N PrD-Sup35C-expressing cells can convert to a prion state. Representative Ade+ cells were isolated and analyzed as in Figure 1C-D. (E) Variant PrD-M-EYFP fusions were expressed for 24 hrs in [RNQ+] cells, followed by SDD-AGE analysis as in Figure 1D. (F) The sequence of Huntingtin exon 1 with a homopolymeric expansion of 47 Qs (top), and the N variant (bottom). (G) HttQ47 and HttN47 fused to EYFP were expressed for 24 hrs in [rnq−] or [RNQ+] cells, followed by SDD-AGE analysis as in Figure 1E. See also Figure S3.
Figure 4
Figure 4. N-richness reduces proteotoxicity of Q/N-rich proteins
(A) Single-copy plasmids coding for PrD-EYFP fusions were introduced into [RNQ+] cells. Expression was induced by addition of galactose for 48 hours and protein localization was determined by fluorescence microscopy. (B) Isogenic [rnq−] or [RNQ+] yeast bearing the indicated Sup35 PrD-EYFP variants were spotted as 5-fold serial dilutions to plates that either induced (galactose) or repressed (glucose). Growth on glucose established that equal cell densities were plated for each variant. Differences in growth on galactose indicate toxicity resulting from expression of the indicated protein. Duplicate transformants are shown. White dashed lines are provided only for clarity; comparisons are made between cells growing on the same plate. (C) As in (B), but with HttQ47- and HttN47-EYFP. See also Figure S4.
Figure 5
Figure 5. Q-rich proteins preferentially form non-amyloid conformers
(A) Quantitation of soluble, amyloid, and non-amyloid aggregated protein in assemblies of Sup35 PrD-M-His7 variants. Freshly diluted 5 μM solutions were induced to assemble with end-over-end agitation for 24 hrs. Soluble and aggregated fractions were partitioned by centrifugation at 39,000 rcf for 30 min. The aggregate fraction was further resuspended in 1 % SDS and allowed to incubate at 25°C for 30 min, followed by a second centrifugation step. Protein concentrations are shown (+/− SEM) for the original supernatant (“soluble”), post-SDS supernatant (“non-amyloid aggregation”) and post-SDS pellet (“amyloid aggregation”). (B–C) Toxicity of variant Sup35 PrD-M-His7 assemblies to human neuroblastoma cells. SH-SY5Y cells incubated for 15 hrs with 2.5 μM of either freshly diluted or pre-aggregated protein, as indicated, were visually inspected for cell detachment (B) or assayed for membrane disruption by adenylate kinase release (C). See also Figure S5.
Figure 6
Figure 6. Q-rich proteins have reduced rates of conformational conversion to amyloid
(A) Sup35 PrD-M-His7 variants were diluted to 2.5 μM in assembly buffer and incubated for the indicated times prior to the removal of 50 μl to a nitrocellulose membrane. Pre-amyloid oligomers (top) or total protein (bottom) were detected with A11 or anti-His6 antibodies respectively. (B) Sup35 PrD-M-His7 variants were diluted to 7.5 μM in assembly buffer containing ThT, followed immediately by the addition of various concentrations (% m/m) of the respective preformed sonicated amyloid fibers. Reactions were incubated without agitation and monitored for amyloid polymerization by ThT fluorescence. Nonlinear regression (as shown on left for WT, fit to one-phase association curves) was used to determine initial rates of amyloid elongation (as shown in middle, plotted against normalized seed concentrations). Dotted lines denote the 95% CI of the best fit line. Slopes of the best fit lines show the seeding efficiencies of each variant amyloid preparation, relative to WT (right). (C) The ability of individual variants to polymerize onto heterologous pre-assembled amyloids. 5 μM soluble protein was seeded with 10% (m/m) preformed aggregates in each case. Data show means +/− SEM. See also Figure S6.
Figure 7
Figure 7. Molecular simulations of polyN (N30) and polyQ (Q30)
(A) Percentage of ordered β-sheet formed by N30 and Q30. Single N30 and Q30 molecules were simulated in the absence (dark blue) or presence (yellow) of local conformational restraints that restrict conformational sampling to dihedral angles drawn from the β-basin in conformational space. Pairs of N30 and Q30 molecules simulated with (cyan) or without (dark brown) local conformational restraints show the effects of homotypic intermolecular interactions on ordered βsheet content. Shown are means +/− SD from five simulations. (B) Temperature-dependent probabilities of realizing homotypic intermolecular associations, quantified as the probability that the intermolecular (center-of-mass to center-of-mass) distance between the pair of restrained / unrestrained N30 or Q30 molecules is ≤ 25Å (corresponding to less than 0.025% of the total volume available to the molecules in the simulation setup). Simulations were performed for pairs of N30 and Q30 molecules without (dark blue and yellow) and with (cyan and dark brown) local conformational restraints. Shown are means +/− SD from five simulations. (C) Visual comparison of ordered β-sheet structures formed by N30 (left) and Q30 (right) molecules in the presence of local conformational restraints. Note the tight type I β-turn formed by N30 relative to Q30, and the resulting differences in the lengths of intramolecular antiparallel β-sheets. When the entropic penalty is pre-paid using conformational restraints, we find a greater frequency of sampling intramolecular β-sheet structures with N30 because asparagine tracts can form canonical β-turns through backbone and sidechain hydrogen bonds, a representative of which is shown in the enlarged picture in green for N30. Conversely, Q-rich tracts form longer loops that lack any of the hallmarks of canonical turns and this increases the barrier for strand nucleation and propagation (Finkelstein, 1991).

References

    1. Alberti S, Halfmann R, King O, Kapila A, Lindquist S. A systematic survey identifies prions and illuminates sequence features of prionogenic proteins. Cell. 2009;137:146–158. - PMC - PubMed
    1. Allen KD, Chernova TA, Tennant EP, Wilkinson KD, Chernoff YO. Effects of ubiquitin system alterations on the formation and loss of a yeast prion. J Biol Chem. 2007;282:3004–3013. - PubMed
    1. Buchan JR, Muhlrad D, Parker R. P bodies promote stress granule assembly in Saccharomyces cerevisiae. J Cell Biol. 2008;183:441–455. - PMC - PubMed
    1. Chernoff YO, Lindquist SL, Ono B, Inge-Vechtomov SG, Liebman SW. Role of the chaperone protein Hsp104 in propagation of the yeast prion-like factor [psi+] Science. 1995;268:880–884. - PubMed
    1. Chernoff YO, Newnam GP, Kumar J, Allen K, Zink AD. Evidence for a protein mutator in yeast: role of the Hsp70-related chaperone ssb in formation, stability, and toxicity of the [PSI] prion. Mol Cell Biol. 1999;19:8103–8112. - PMC - PubMed

Publication types

MeSH terms

LinkOut - more resources