. 2011 Jul 8;9(1):64-73.
doi: 10.1016/j.stem.2011.04.021.

All hematopoietic cells develop from hematopoietic stem cells through Flk2/Flt3-positive progenitor cells

Affiliations

All hematopoietic cells develop from hematopoietic stem cells through Flk2/Flt3-positive progenitor cells

Scott W Boyer et al. Cell Stem Cell. .

Abstract

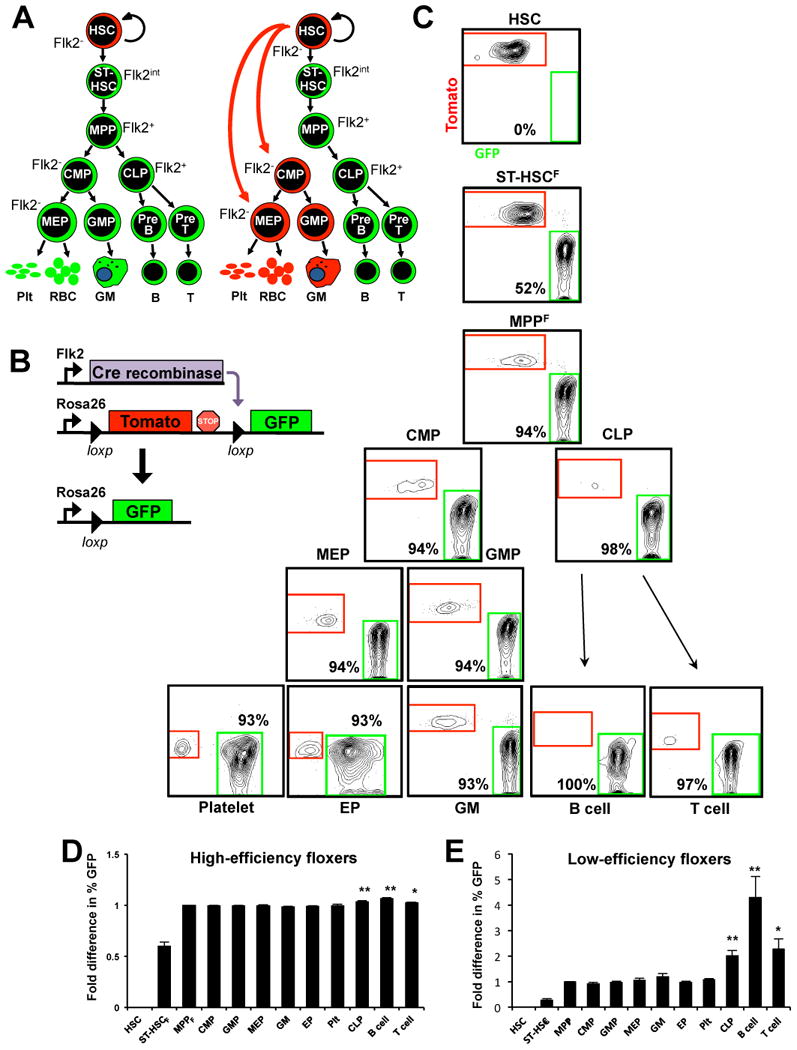
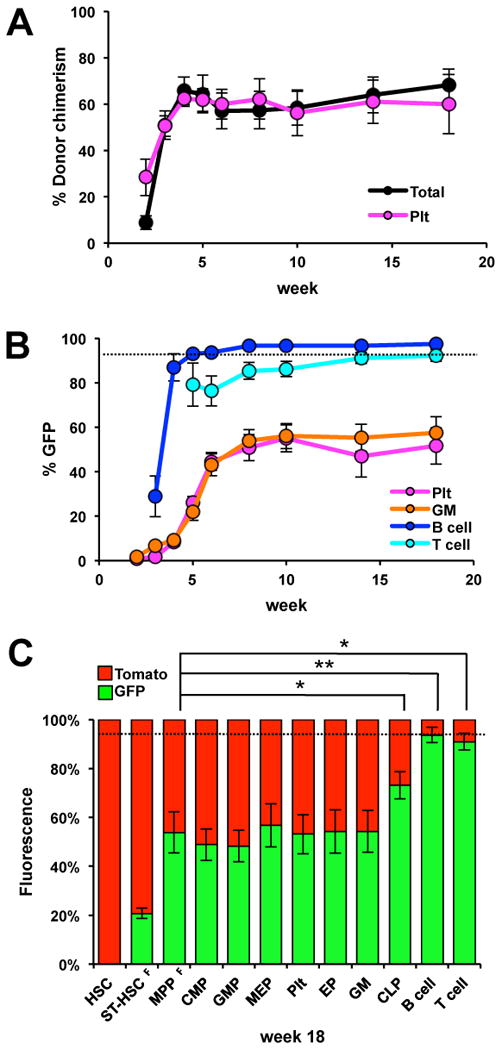
While it is clear that a single hematopoietic stem cell (HSC) is capable of giving rise to all other hematopoietic cell types, the differentiation paths beyond HSC remain controversial. Contradictory reports on the lineage potential of progenitor populations have questioned their physiological contribution of progenitor populations to multilineage differentiation. Here, we established a lineage tracing mouse model that enabled direct assessment of differentiation pathways in vivo. We provide definitive evidence that differentiation into all hematopoietic lineages, including megakaryocyte/erythroid cell types, involves Flk2-expressing non-self-renewing progenitors. A Flk2+ stage was used during steady-state hematopoiesis, after irradiation-induced stress and upon HSC transplantation. In contrast, HSC origin and maintenance do not include a Flk2+ stage. These data demonstrate that HSC specification and maintenance are Flk2 independent, and that hematopoietic lineage separation occurs downstream of Flk2 upregulation.


Conflict of interest statement

The authors declare no conflicts of interest.

Figures

Figure 1
Figure 1. Hematopoietic stem cell progeny switch from Tomato to GFP expression in FlkSwitch mice
(A) Two simplified alternative models for HSC differentiation. Cell types that are Flk2-positive or derived from Flk2-positive cells should express GFP, while Flk2-negative cells that have no history of Flk2 expression should express Tomato. (B) Strategy for the generation of FlkSwitch reporter mice. (C) Representative flow cytometer data of Tomato and GFP expression in multiple cell populations from a FlkSwitch mouse with high floxing efficiency (mouse number 8 in Table 1). (D) Fold difference in percent GFP+ cells compared to MPPF in high-efficiency floxers (mice numbers 6-14 in Table 1; n=9), and (E) low-efficiency floxers (mice numbers 1-5 in Table 1; n=5). * p<0.01, ** p<0.001 by Wilcoxon Signed Rank test, calculated using the raw GFP percentage (Table 1). GFP percentages in HSC and ST-HSCF were significantly different from all other hematopoietic cell types. HSC, hematopoietic stem cells; ST-HSCF, short-term hematopoietic stem cells; MPPF, multipotent progenitors; CMP, common myeloid progenitors, GMP, granulocyte/macrophage progenitors; MEP, megakaryocyte/erythroid progenitors; GM, granulocyte/macrophage cells; EP, erythroid progenitors; RBC, red blood cells; Plt, platelets; CLP, common lymphoid progenitors; B, B cells; T, T cells. Error bars indicate standard error of the mean (SEM). See also Figure S1.
Figure 2
Figure 2. Lack of Cre expression and activity in myeloid progenitors at steady-state and upon in vivo and in vitro differentiation
(A) Quantitative RT-PCR analyses of Cre recombinase mRNA levels in Flk2+ (MPPF) and Flk2- (HSC; myeloid progenitors (MyPro; Lin-c-kit+Sca1- cells), and erythroid progenitors (EP; Ter119-Mac1-Gr1-B220-CD3-CD71+)) cell populations from FlkSwitch mice revealed that only MPPF express Cre. Bar graph indicates the relative levels of Cre mRNA in cell populations sorted from individual (grey bar) or multiple (white bar; n=3) FlkSwitch mice. β-actin was used as a positive control for all populations. Error bars indicate SEM. (B-D) Tom+ CMP remain unfloxed during myeloid development. (B) Flow cytometry analysis of CMP progeny after 10 days of in vitro methylcellulose culture (n=6 in 2 independent experiments). (C) Tom and GFP analysis of donor-derived nucleated cells (total), GM, B-cells, T-cells, and Plts in PB of sublethally irradiated mice transplanted with Tomato+ or GFP+ MPPF (800 per mouse) or CMP (10,000 per mouse) (n=5-7 in 2 independent experiments). (D) Erythroid progenitor (EP) readout in spleens of lethally irradiated mice 9 days post-transplantation of Tom+ or GFP+ MPPF or CMP (n=10 in 2 independent experiments).
Figure 3
Figure 3. Tomato-positive MPPF and CMP exhibit similar in vivo reconstitution potential as their GFP-positive counterparts
(A) Quantitative RT-PCR analyses of Cre recombinase and Flk2 mRNA levels in Tom+ and GFP+ MPPF isolated from individual FlkSwitch mice (n=4). (B-E) Tom+ and GFP+ MPPF (B, D) and CMP (C, E) give rise to similar numbers of Plts, GM, B and T cells (B-C) and CFU-S (D-E). Purified Tom+ and GFP+ MPPF (800 per mouse, n=7 and 8) or Tom+ and GFP+ CMP (10,000 per recipient, n=5) were transplanted into sublethally irradiated hosts and the PB readout was analyzed weekly for 30 days posttransplantation (B-C). For CFU-S analysis, 300 Tom+ or GFP+ MPPF (n=10) or 200 Tom+ and GFP+ CMP (n=10 in 2 independent experiments) per recipient were transplanted into lethally irradiated hosts. CFU-S were enumerated 11 or 9 days posttransplantation (D-E). (E) The percentage of GFP+ cells in PB myeloid cells correlates with Cre transgene copy number. Error bars in A-E indicate SEM; no comparisons were statistically significantly different.
Figure 4
Figure 4. Hematopoietic differentiation under irradiation-induced stress progresses through a Flk2-positive stage
(A) Analysis of PB cells of FlkSwitch mice before and after irradiation-induced stress revealed a myeloid-specific decrease in the percentage of cells expressing the GFP reporter gene, with a concomitant increase in the percentage of cells expressing Tomato. GFP percentages in Plts (black line), GM, B and T cells (not shown) remain unchanged over time in unirradiated mice. (B-D) Ratio of GFP to Tomato expression in BM cell populations without irradiation (B), 2 weeks after one sublethal irradiation dose (C), and 19 weeks after two sublethal doses administered at wks 0 and 5 (D), demonstrating that the decrease in MPPF floxing efficiency is reflected in myeloid populations. The black dotted line indicates average GFP percentages of myeloid PB cells of the same mice prior to irradiation. Error bars indicate SEM. P-values were determined using a paired two-tailed t-test. * p<0.05, ** p<0.005, ***, p<0.0005, **** p<0.00005. GFP percentages in HSC and ST-HSCF were significantly different from all other hematopoietic cell types (B-D).
Figure 5
Figure 5. HSC differentiate into all lineages through a Flk2-positive stage upon transplantation
(A) Donor chimerism in recipient mice transplanted with 100 HSC from FlkSwitch mice demonstrate robust long-term engraftment of nucleated (GM, B and T cells) PB cells, as well as Plts. (B) GFP percentages of donor-derived B cells, Plts and GM cells increase for the first few weeks after transplantation and then remain stable. (C) BM analysis of recipient mice >16 wks posttransplantation revealed that MPPF displayed similar GFP percentages as myeloid progenitors, Plts and GM cells. The black dotted line indicates the GFP percentage of MPP of the same mice prior to transplantation. (n=7 in 2 independent experiments). Error bars indicate SEM. P-values were determined using a two-tailed paired t-test. * p< 0.005, ** p<0.001. GFP percentages in HSC and ST-HSCF were significantly different from all other hematopoietic cell types.

References

    1. Adolfsson J, Borge OJ, Bryder D, Theilgaard-Monch K, Astrand-Grundstrom I, Sitnicka E, Sasaki Y, Jacobsen SE. Upregulation of Flt3 expression within the bone marrow Lin(-)Sca1(+)c-kit(+) stem cell compartment is accompanied by loss of self-renewal capacity. Immunity. 2001;15:659–669. - PubMed
    1. Adolfsson J, Mansson R, Buza-Vidas N, Hultquist A, Liuba K, Jensen CT, Bryder D, Yang L, Borge OJ, Thoren LA, Anderson K, Sitnicka E, Sasaki Y, Sigvardsson M, Jacobsen SE. Identification of Flt3+ lympho-myeloid stem cells lacking erythro-megakaryocytic potential a revised road map for adult blood lineage commitment. Cell. 2005;121:295–306. - PubMed
    1. Akashi K. Lymphoid lineage fate decision of hematopoietic stem cells. Ann N Y Acad Sci. 2009;1176:18–25. - PubMed
    1. Akashi K, Traver D, Miyamoto T, Weissman IL. A clonogenic common myeloid progenitor that gives rise to all myeloid lineages. Nature. 2000;404:193–197. - PubMed
    1. Akashi K, Traver D, Zon LI. The complex cartography of stem cell commitment. Cell. 2005;121:160–162. - PubMed

Publication types