. 2011 Aug 16;50(32):6888-900.
doi: 10.1021/bi2007993. Epub 2011 Jul 15.

Applying the brakes to multisite SR protein phosphorylation: substrate-induced effects on the splicing kinase SRPK1

Affiliations

Applying the brakes to multisite SR protein phosphorylation: substrate-induced effects on the splicing kinase SRPK1

Brandon E Aubol et al. Biochemistry. .

Abstract

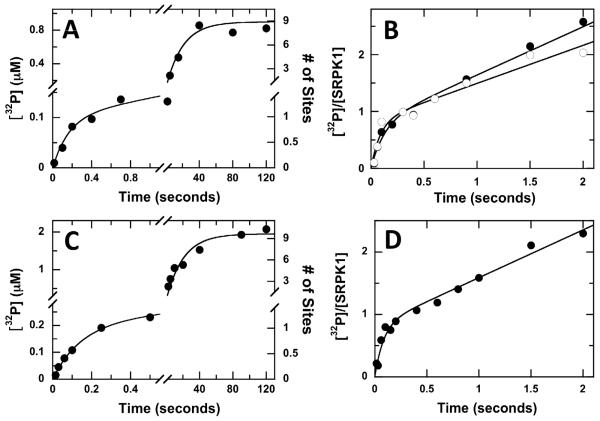
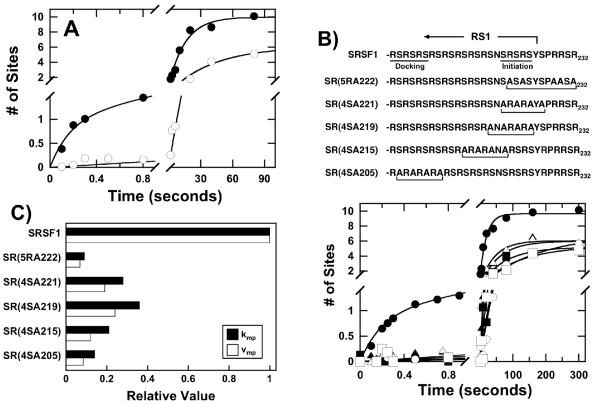
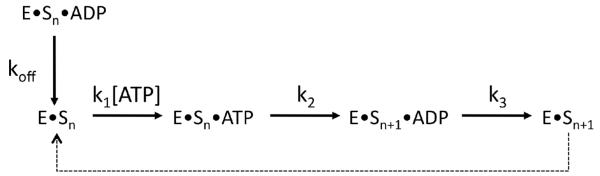
To investigate how a protein kinase interacts with its protein substrate during extended, multisite phosphorylation, the kinetic mechanism of a protein kinase involved in mRNA splicing control was investigated using rapid quench flow techniques. The protein kinase SRPK1 phosphorylates ~10 serines in the arginine--serine-rich domain (RS domain) of the SR protein SRSF1 in a C- to N-terminal direction, a modification that directs this essential splicing factor from the cytoplasm to the nucleus. Transient-state kinetic experiments illustrate that the first phosphate is added rapidly onto the RS domain of SRSF1 (t(1/2) = 0.1 s) followed by slower, multisite phosphorylation at the remaining serines (t(1/2) = 15 s). Mutagenesis experiments suggest that efficient phosphorylation rates are maintained by an extensive hydrogen bonding and electrostatic network between the RS domain of the SR protein and the active site and docking groove of the kinase. Catalytic trapping and viscosometric experiments demonstrate that while the phosphoryl transfer step is fast, ADP release limits multisite phosphorylation. By studying phosphate incorporation into selectively pre-phosphorylated forms of the enzyme-substrate complex, the kinetic mechanism for site-specific phosphorylation along the reaction coordinate was assessed. The binding affinity of the SR protein, the phosphoryl transfer rate, and ADP exchange rate were found to decline significantly as a function of progressive phosphorylation in the RS domain. These findings indicate that the protein substrate actively modulates initiation, extension, and termination events associated with prolonged, multisite phosphorylation.


Figures

Figure 1
Figure 1. Structure and Phosphorylation Mechanism of SRSF1
A) SRSF1 Domain Structure. SRSF1 has two RRMs and a C-terminal RS domain composed of RS1 and RS2 segments. B) Structure of SRPK1 core with AMPPNP and the N-terminal portion of RS1 segment (R204SRSRSR) bound to the docking groove in the large lobe. Arginines are colored blue and serines are colored red. A hydrogen bond is formed between the hydroxyl of Ser207 and the backbone carbonyl of Ser209. RRM2 is not displayed in this depiction. C) Phosphorylation Model. SRPK1 binds SRSF1 with high affinity using an electronegative docking groove that initially recognizes the N-terminal portion of RS1. Upon progressive phosphorylation, RS1 is threaded through the docking groove and into the active site in a C-to-N-terminal direction. In later phosphorylation stages, β4 from RRM2 unfolds and binds in the docking groove and phosphoserines in RS1 are stabilized by an electropositive site (P+2 site)
Figure 2
Figure 2. Phosphorylation of Full-Length and Truncated SRSF1 Using Rapid Quench Flow Methods
A&C) Single Turnover Experiments. A complex of SRPK1 (2 μM) and SRSF1 (0.2 μM) (A) or RS domain (0.4 μM) (C) in one syringe is mixed with ATP (200 μM) in the second syringe in the rapid quench flow machine. Final concentrations are 1 μM SRPK1, 100 μM ATP, 0.1 μM SRSF1 in (A) or 0.2 μM RS domain in (C). For SRSF1, the data are fit to values of 6 ± 2 sec−1 for kp, 0.042 ± 0.010 sec−1 for kmp, 0.10 ± 0.03 μM for αp and 0.80 ± 0.10 μM for αmp. For the RS domain, the data are fit to values of 7 ± 3 sec−1 for kp, 0.048 ± 0.010 sec−1 for kmp, 0.20 ± 0.04 μM for αp and 1.8 ± 0.10 μM for αmp. B&D) Pre-Steady-State Kinetic Experiments. A complex of SRPK1 (0.25 or 0.5 μM) and SRSF1 (1 μM) in (B) or SRPK1 (0.5 μM) and RS domain (5μM) in (D) is mixed with ATP (200 μM) in the rapid quench flow machine. Final concentrations in (B) are 0.125 (●) or 0.25 μM (○) SRPK1, 0.5 μM SRSF1 and 100 μM ATP. The data for SRSF1 phosphorylation at 0.125 and 0.25 μM SRPK1 are fit to equation (1) to obtain the respective values of 8 ± 2 and 11 ± 5 sec−1 for kb, 0.79 ± 0.11 and 0.82 ± 0.13 for α, and 0.85 ± 0.10, and 0.82 ± 0.13 sec−1 for kL. Final concentrations in (D) are 2.5 μM RS domain, 0.25 μM SRPK1 and 100 μM ATP. The data for RS domain phosphorylation are fit to equation (1) to obtain the respective values of 12 ± 3 sec−1 for kb, 0.80 ± 0.10 for a, and 0.75 ± 0.08 for kL.
Figure 3
Figure 3. Enzyme-Substrate Interactions Support Phosphorylation Rates
A) Docking Groove. The phosphorylation of SRSF1 by a form of SRPK1 containing 6 mutations in the docking groove [SRPK1(6M)] was studied. The data for wild-type SRPK1 (●) are fit to values of 5.7 sec−1 for kp, 0.063 for kmp, 1 site for αp, and 9 sites for αmp. For SRPK1(6M) (○) the data are fit to single exponential function with values of 0.023 sec−1 for kmp and 6.1 sites for αmp. B) RS Domain. The phosphorylation of multiple Arg-to-Ala and Ser-to-Ala mutants in the RS domain of SRSF1 by SRPK1 were studied. For wild-type SRSF1 (●), values of 5 sec−1 for kp, 0.050 sec−1 for kmp, 1 site for αp and 8.7 sites for αmp are obtained. The data for the mutants are fit to single exponential functions with values of 0.0057 sec−1 (kmp) and 6.9 sites (αmp) for SR(5RA222) (○), 0.018 sec−1 (kmp) and 6.0 sites (αmp) for SR(4SA221) (▲), 0.023 sec−1 (kmp) and 6.0 sites (αmp) for SR(4SA219) (△), 0.013 sec−1 (kmp) and 5.2 sites (αmp) for SR(4SA215) (■), 0.009 sec−1 (kmp) and 5.3 sites (αmp) for SR(4SA205) (□). C) Multi-Site Phosphorylation. The bar graph displays the ratio of kmp and vmp (kmp x αmp) for the mutants compared to SRSF1.
Figure 4
Figure 4. Positional Analyses of the Phosphoryl Transfer Rate
A) Pre-phosphorylation of SRSF1. Complexes of SRPK1 (1 μM) and SRSF1 (100 nM) are incubated with limiting 32P-ATP (0-5 μM) for 20 min to attain 0, 1.2, 4, 6.3 and 8.3 phosphates (0P, 1P, 4P, 6P, 8P) onto the RS1 segment. B) Single Turnover Kinetics. Excess 32P-ATP (100 μM) is added to the complexes generated in (A) and the phosphorylation of the remaining sites is monitored. The data are fit to values of 3.6 ± 1.0 sec−1 for kp, 0.050 ± 0.006 sec−1 for kmp, 1.0 ± 0.18 sites for αp and 9.1 ± 0.35 sites for αmp for 0P (●), 3.8 ± 1.2 sec−1 for kp, 0.050 ± 0.004 sec−1 for kmp, 1.1 ± 0.20 sites for αp and 7.5 ± 0.25 sites for αmp for 1P (○), 4.3 ± 1.5 sec for kp, 0.040 ± 0.004 sec−1 for kmp, 1.1 ± 0.14 sites for αp and 4.9 ± 0.35 sites for αmp for 4P (▲), 3.0 ± 1.0 sec−1 for kp, 0.035 ± 0.004 sec−1 for kmp, 0.80 ± 0.05 sites for αp and 2.9 ± 0.08 sites for αmp for 6P (△) and 3.0 ± 1.1 sec−1 for kp, 0.040 ± 0.003 sec−1 for kmp, 0.32 ± 0.05 sites for αp and 1.4 ± 0.25 sites for α mp for 8P (◆). C) Amplitude and Linear Rates. The values of αp and vmp (kmp x αmp) from (B) are plotted as a function of pre-phosphorylation state of SRSF1. D) SRPK1 & ATP Dependence. The 8P complex is generated as described in panel (A) and the reaction is then started with either 400 μM 32P-ATP (●) or 4 μM SRPK1 (○). The data are fit to values of 4.0 ± 0.80 sec−1 (kp), 0.030 ± 0.004 sec−1 (kmp), 0.33 ± 0.06 sites (αp) and 1.7 ± 0.06 sites (αmp) at 400 μM P-ATP and 4.6 ± 0.82 sec−1 (kp), 0.031 ± 0.004 sec−1 (kmp), 0.67 ± 0.037 sites (αp) and 1.3 ± 0.06 sites (αmp) at 4 μM SRPK1. The 0P complex is also reacted with 600 μM 32P-ATP (▲) and fit to values of 25 ± 8 sec−1 (kp), 0.043 ± 0.006 sec−1 (kmp), 0.91 ± 0.16 sites (αp) and 9.0 ± 0.39 sites (αmp)
Figure 5
Figure 5. Effects of Sucrose on the Steady-State Kinetic Parameters for SRPK1
Initial velocities for SRPK1 are plotted as a function of total SRSF1 at fixed ATP (A) or as a function of ATP at fixed SRSF1 (C) using 0% (●), 10% (○), 25% (▲), and 30% (△) sucrose. In the absence of sucrose, the kcat and Km for SRSF1 are 56 ± 5 min−1 and 70 ± 6 nM using fixed ATP (100 μM) and the kcat and Km for ATP are 50 ± 5 min−1 and 12 ± 2 μM using fixed SRSF1 (1 μM). The effects of added sucrose on the relative steady-state kinetic parameters [kcat°/kcat and (kcat/Km)°/(kcat/Km)] are plotted as a function of relative solvent viscosity (ηrel) under conditions of varying SRSF1 (B) or ATP (D). For varying SRSF1, kcatη and (kcat/Km)η are 1.2 ± 0.16 and 0.90 ± 0.10. For varying ATP, kcatη and (kcat/Km)η are 1.2 ± 0.18 and 1.0 ± 0.05. Initial velocities for SRPK1 as a function of Block Mutant are plotted in panel (E) at fixed ATP (100 μM). In the absence of sucrose, the kcat and Km for SRSF1 are 2.4 ± 0.25 min−1 and 2.1 ± 0.60 μM. For varying Block Mutant,kcatη and (kcat/Km)η are −.020 ± 0.043 and 0.090 ± 0.010.
Figure 6
Figure 6. Nucleotide Exchange Kinetics in the SRPK1-SRSF1 Complex
A) ATP-Dependent Kinetic Transients. A complex of SRPK1 (0.5 μM) and SRSF1 (1 μM) in one syringe is mixed with ATP (100 or 1000 μM) in the second syringe in the rapid quench flow machine. Final concentrations are 50 (●) or 500 μM (○) ATP, 0.25 μM SRPK1 and 0.5 μM for SRSF1. The data are simulated using DynaFit (26) and Scheme 2 to obtain values of 0.09 μM−1sec−1, 30 sec−1, and 0.8 sec−1 for k1, k2, and k3, respectively. B) ADP Binding Affinity. Initial reaction velocities are measured as a function of ATP (6-800 μM) at fixed SRSF1 (1 μM) in the absence (●) and presence of 30 (○), 60 (▲), and 120 μM (△) ADP. KI = 10 μM for ADP. C) ADP Catalytic Trapping From 0P. A complex of SRPK1 (0.5 μM) and SRSF1 (1 μM) with (○) or without (●) ADP (120 μM) in one syringe is mixed with ATP (1200 μM) in the second syringe of the rapid quench flow machine. Final concentrations are 600 μM ATP, 0.25 μM SRPK1, 0.5 μM SRSF1 and 60 μM ADP. The data in the absence of ADP are simulated using DynaFit and Scheme 2 to obtain values of 0.09 μM−1sec−1, 30 sec−1, and 1.1 sec−1 for k1, k2, and k3, respectively. These values are then used to simulate the data in the presence of ADP using the mechanism in Scheme 3 and DynaFit to obtain a koff for ADP of 1.1 sec−1. D) ADP Catalytic Trapping from 4P. A complex of SRPK1 (2 μM) and SRSF1 (0.26 μM) is prequibrated for 20 min with 3 μM 32P-ATP to generate a 4P complex. This complex is incubated with (○) or without (●) ADP (120 μM) in one syringe and then mixed with ATP (1200 μM) in the second syringe of the rapid quench flow machine. Final concentrations are 600 μM ATP, 1 μM SRPK1, 0.13 μM SRSF1 and 60 μM ADP. The data in the absence of ADP are simulated using DynaFit and Scheme 2 to obtain values of 0.04 μM−1sec−1, 2.7 sec−1, and 0.10 sec−1 for k1, k2, and k3, respectively. These values are then used to simulate the data in the presence of ADP using the mechanism in Scheme 3 and DynaFit to obtain a koff for ADP of 0.13 sec−1.
Figure 7
Figure 7. Effects of Phosphorylation Progress on Individual Steps
A) Simulation of Progress Curves. The progress curves for 0P (○) and 4P (△) (data from Fig.4B) were simulated using DynaFit and a sequential mechanism in which 0P converts step-wise to 10P. The irreversible, net rate constants for each individual step are defined by reactant phosphorylation state (k0P, k1P, k2P,…k9P). Simulations for 0P include k0P through k9P whereas those for 4P include k4P through k9P. Values of 5, 1, 0.6, 0.45, 0.2, 0.15, 0.12, 0.1, 0.07, and 0.06 sec−1 for k0P, k1P, k2P, k3P, k4P, k5P, k6P, k7P, k8P, and k9P, respectively, were used to simulate 0P. Values of 3, 0.5, 0.1, 0.06, 0.04, and 0.02 sec−1 for k4P, k5P, k6P, k7P, k8P, and k9P, respectively, were used to simulate 4P. For comparison, the analytical fits to both curves are shown as dotted lines and their parameter fits are included in the legend of Fig. 4B. B) Change in Free Energy Reaction Coordinate Diagram As A Function of Phosphorylation. SRPK1 has high affinity for SRSF1, rapidly phosphorylates the first serine in the RS domain and slowly releases ADP (solid line). After several rounds of phosphorylation (6-8P), the affinity of the substrate declines significantly and the phosphoryl transfer and ADP release rates decrease (dashed line).
Scheme 1
Scheme 1
Scheme 2
Scheme 2
Scheme 3
Scheme 3

References

    1. Jurica MS, Moore MJ. Pre-mRNA splicing: awash in a sea of proteins. Mol Cell. 2003;12:5–14. - PubMed
    1. Blencowe BJ, Bowman JA, McCracken S, Rosonina E. SR-related proteins and the processing of messenger RNA precursors. Biochem Cell Biol. 1999;77:277–291. - PubMed
    1. Gui JF, Lane WS, Fu XD. A serine kinase regulates intracellular localization of splicing factors in the cell cycle. Nature. 1994;369:678–682. - PubMed
    1. Ding JH, Zhong XY, Hagopian JC, Cruz MM, Ghosh G, Feramisco J, Adams JA, Fu XD. Regulated cellular partitioning of SR protein-specific kinases in mammalian cells. Mol Biol Cell. 2006;17:876–885. - PMC - PubMed
    1. Zhong XY, Ding JH, Adams JA, Ghosh G, Fu XD. Regulation of SR protein phosphorylation and alternative splicing by modulating kinetic interactions of SRPK1 with molecular chaperones. Genes Dev. 2009;23:482–495. - PMC - PubMed

Publication types

Substances