Comparative Study
. 2011 Jul 5:12:344.
doi: 10.1186/1471-2164-12-344.

Comparative analysis of methods for detecting interacting loci

Affiliations
Comparative Study

Comparative analysis of methods for detecting interacting loci

Li Chen et al. BMC Genomics. .

Abstract

Background: Interactions among genetic loci are believed to play an important role in disease risk. While many methods have been proposed for detecting such interactions, their relative performance remains largely unclear, mainly because different data sources, detection performance criteria, and experimental protocols were used in the papers introducing these methods and in subsequent studies. Moreover, there have been very few studies strictly focused on comparison of existing methods. Given the importance of detecting gene-gene and gene-environment interactions, a rigorous, comprehensive comparison of performance and limitations of available interaction detection methods is warranted.

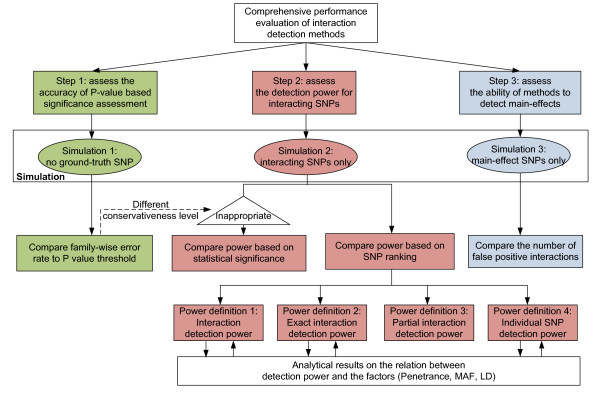
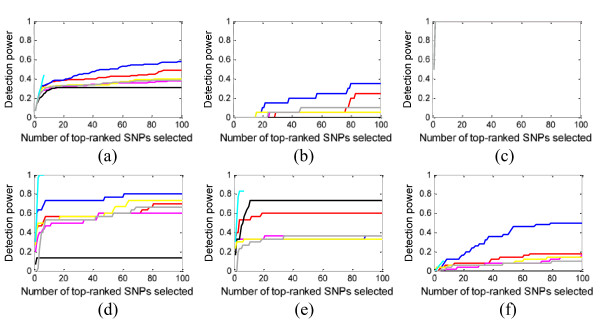
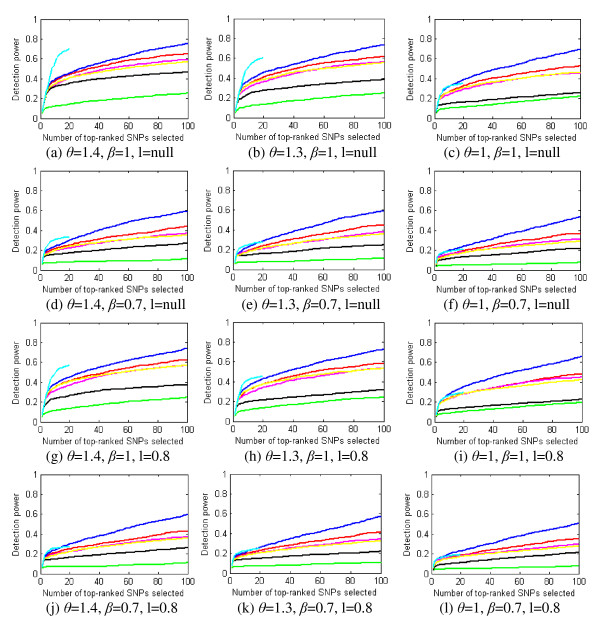
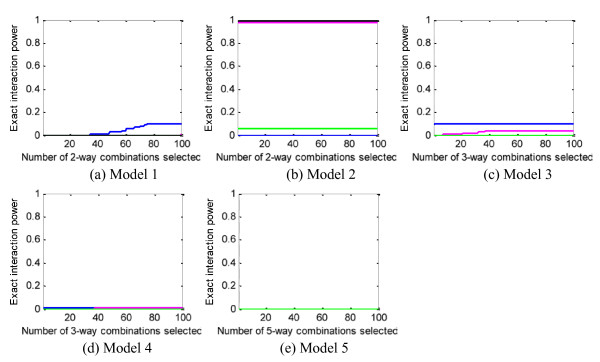
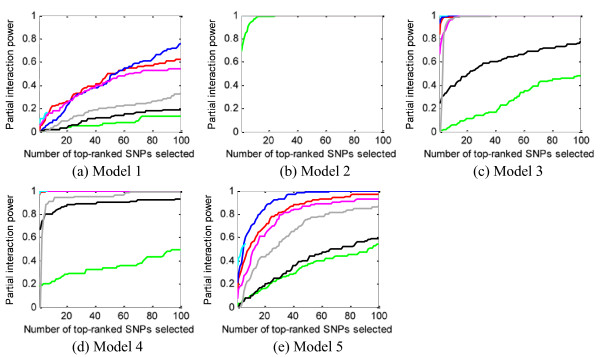
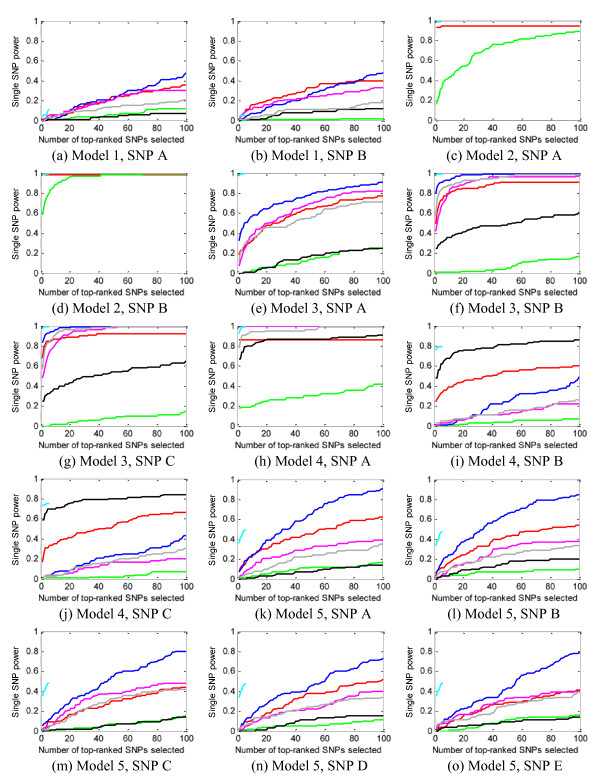
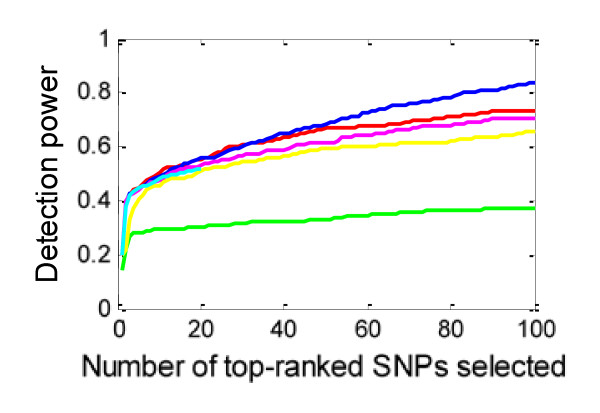
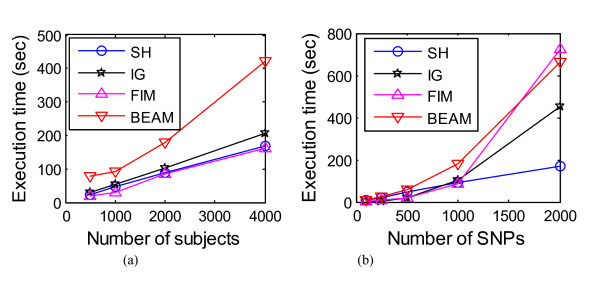
Results: We report a comparison of eight representative methods, of which seven were specifically designed to detect interactions among single nucleotide polymorphisms (SNPs), with the last a popular main-effect testing method used as a baseline for performance evaluation. The selected methods, multifactor dimensionality reduction (MDR), full interaction model (FIM), information gain (IG), Bayesian epistasis association mapping (BEAM), SNP harvester (SH), maximum entropy conditional probability modeling (MECPM), logistic regression with an interaction term (LRIT), and logistic regression (LR) were compared on a large number of simulated data sets, each, consistent with complex disease models, embedding multiple sets of interacting SNPs, under different interaction models. The assessment criteria included several relevant detection power measures, family-wise type I error rate, and computational complexity. There are several important results from this study. First, while some SNPs in interactions with strong effects are successfully detected, most of the methods miss many interacting SNPs at an acceptable rate of false positives. In this study, the best-performing method was MECPM. Second, the statistical significance assessment criteria, used by some of the methods to control the type I error rate, are quite conservative, thereby limiting their power and making it difficult to fairly compare them. Third, as expected, power varies for different models and as a function of penetrance, minor allele frequency, linkage disequilibrium and marginal effects. Fourth, the analytical relationships between power and these factors are derived, aiding in the interpretation of the study results. Fifth, for these methods the magnitude of the main effect influences the power of the tests. Sixth, most methods can detect some ground-truth SNPs but have modest power to detect the whole set of interacting SNPs.

Conclusion: This comparison study provides new insights into the strengths and limitations of current methods for detecting interacting loci. This study, along with freely available simulation tools we provide, should help support development of improved methods. The simulation tools are available at: http://code.google.com/p/simulation-tool-bmc-ms9169818735220977/downloads/list.


Figures

Figure 1
Figure 1
A flowchart for the performance evaluation of interaction detection methods.
Figure 2
Figure 2
A visual illustration of SNP "blocking" and random sampling, used for generating simulated individuals. "Ind i" denotes the ith real individual, and "Sim Ind" denotes the simulated individual. First, genomes of the real individuals are segmented into a number of blocks; second, for each block, a genome segment is randomly drawn from the set of real individuals; finally, the randomly drawn genome segments, for all blocks, are stitched together to form a simulated individual.
Figure 3
Figure 3
A flowchart detailing all of the steps used in producing the simulated GWAS data sets.
Figure 4
Figure 4
Power evaluation (definition 1) of the eight methods on 100 replication data sets with parameter setting: θ = 1.4, β = 1, l = null. (a) evaluates the power on the whole ground-truth SNP set, and (b) (c) (d) (e) (f) evaluate the power individually on the 5 interaction models. Blue curve - SH, magenta curve - FIM, green curve - MDR, black curve - IG, cyan curve - MECPM, grey curve - LRIT, yellow curve - LR.
Figure 5
Figure 5
Power evaluation (definition 1) of six methods on 10 replication data sets with parameter setting: θ = 1.4, β = 1, l = null. (a) evaluates the power on the whole ground-truth SNP set, and (b) (c) (d) (e) (f) evaluate the power individually on the 5 interaction models. In (c), all the methods have overlapped power curve at the upmost part of the figure. Magenta curve - FIM, black curve - IG, red curve - BEAM, blue curve - SH, cyan curve - MECPM, grey curve - LRIT, yellow curve - LR.
Figure 6
Figure 6
The impact of penetrance value (θ), MAF (β), and LD factor (l) on power for the whole ground-truth SNP set. Blue curve - SH, magenta curve - FIM, green curve - MDR, black curve - IG, cyan curve - MECPM, yellow curve LR..
Figure 7
Figure 7
Power evaluation (definition 2) of the methods on 100 replication data sets with parameter setting: θ = 1.4, β = 1, l = null. In (a), FIM, IG, MDR and LRIT have power constantly equal to 0; in (b) FIM and IG and LRIT have power constantly equal to 1; in (d) SH, FIM and MDR have power constantly equal to 0. Blue curve - SH, magenta curve - FIM, green curve - MDR, black curve - IG, grey curve - LRIT, yellow curve - LR.
Figure 8
Figure 8
Power evaluation (definition 3) of the eight methods on 100 replication data sets with parameter setting: θ = 1.4, β = 1, l = null. Blue curve - SH, magenta curve - FIM, green curve - MDR, black curve - IG, grey curve - LRIT, yellow curve - LR.
Figure 9
Figure 9
The power to detect individual SNPs, for parameter θ = 1.4, β = 1, l = null. Blue curve - SH, magenta curve - FIM, green curve - MDR, black curve - IG, cyan curve -MECPM, grey curve - LRIT, yellow curve - LR.
Figure 10
Figure 10
Power evaluation of 6 methods (using power definition 1) on main-effects-only data (step 3). Blue curve - SH, magenta curve - FIM, green curve - MDR, cyan curve - MECPM, yellow curve - LR.
Figure 11
Figure 11
Execution time (sec) of 4 methods for: (a) number of SNPs = 1,000; (b) number of subjects = 2,000. Due to limited space in (b), we list hereby the execution time of the methods on 2000-subject 10,000-SNP data: SH - 962 seconds, IG - 18291 seconds, BEAM - 36423 seconds, FIM - 91251 seconds.

Similar articles

Cited by

References

    1. Brookes A. Review: the essence of SNPs. Gene. 1999;234:177–186. doi: 10.1016/S0378-1119(99)00219-X. - DOI - PubMed
    1. Couzin J, Kaiser J. Genome-wide association. Closing the net on common disease genes. Science. 2007;316:820–2. doi: 10.1126/science.316.5826.820. - DOI - PubMed
    1. Hirschhorn J. Genome-wide association studies for common diseases and complex traits. Nature reviews Genetics. 2005;6:95–108. - PubMed
    1. Donnelly P. Progress and challenges in genome-wide association studies in humans. Nature. 2008;456:728–31. doi: 10.1038/nature07631. - DOI - PubMed
    1. Manolio TA. et al.Finding the missing heritability of complex diseases. Nature. 2009;461:747–53. doi: 10.1038/nature08494. - DOI - PMC - PubMed

Publication types

LinkOut - more resources