Review
. 2011 Nov;30(6):431-51.
doi: 10.1016/j.preteyeres.2011.06.003. Epub 2011 Jun 26.

Polarization sensitive optical coherence tomography in the human eye

Affiliations
Review

Polarization sensitive optical coherence tomography in the human eye

Michael Pircher et al. Prog Retin Eye Res. 2011 Nov.

Abstract

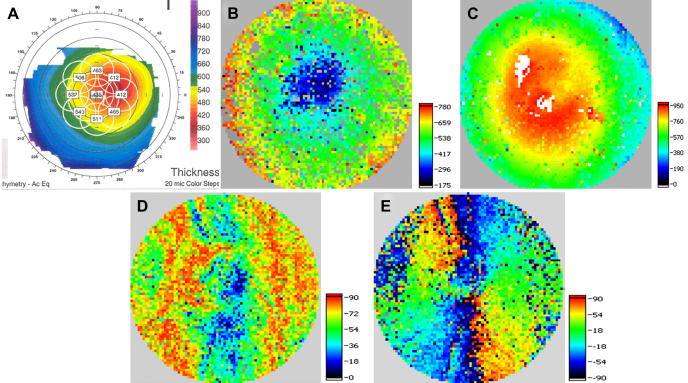
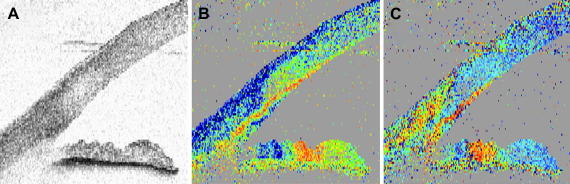
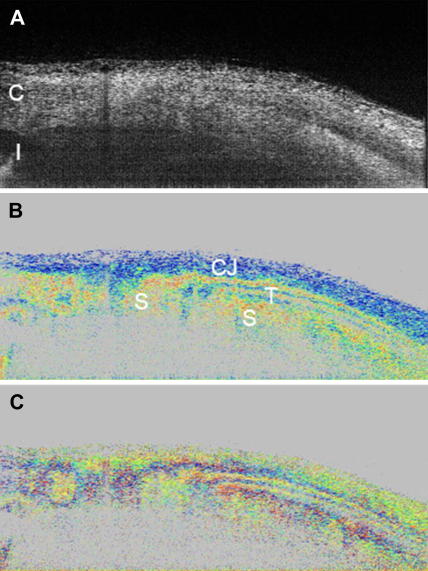
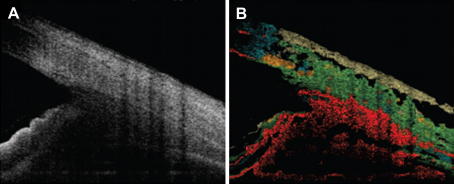
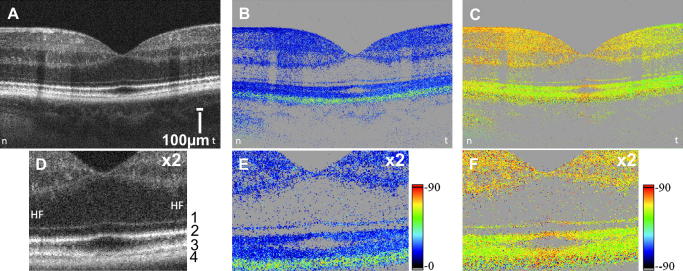
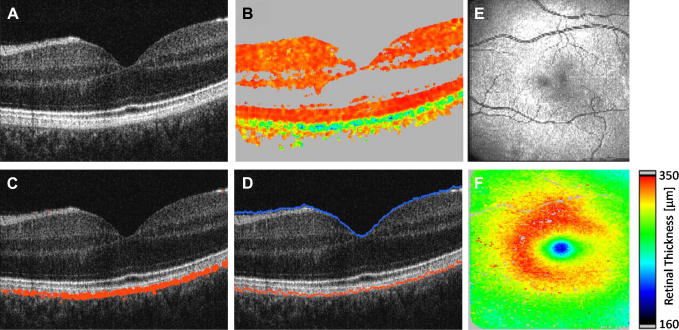
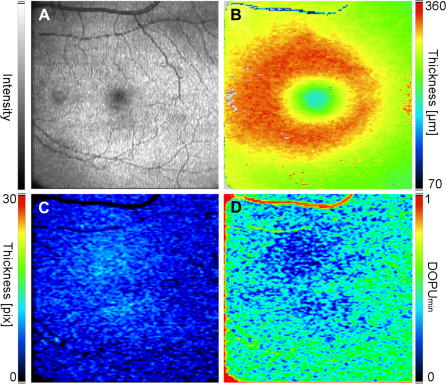
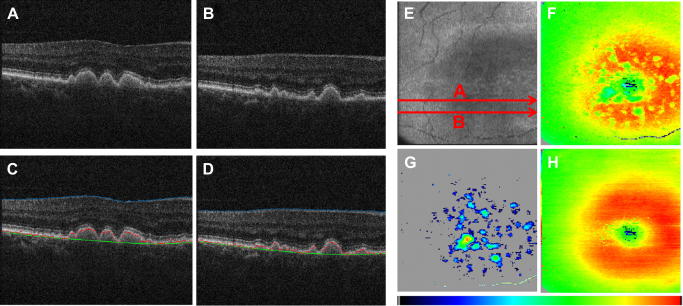
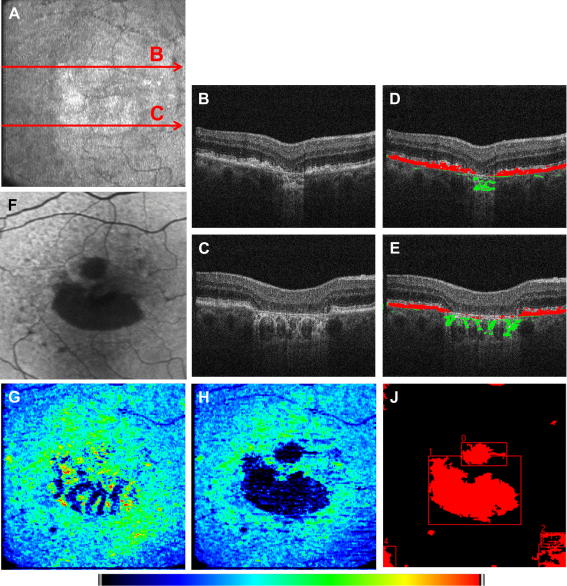
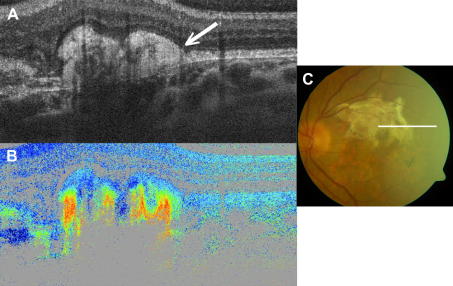
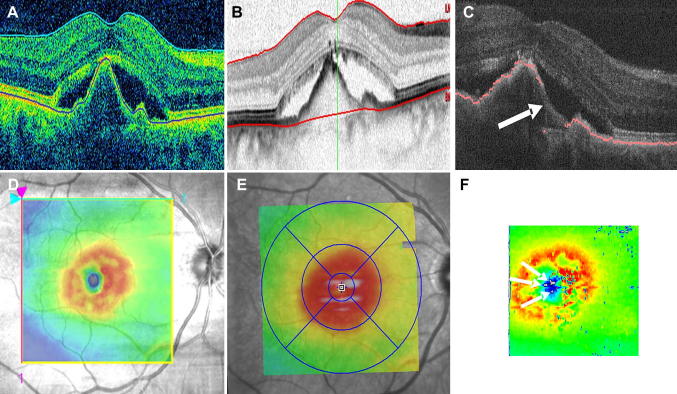
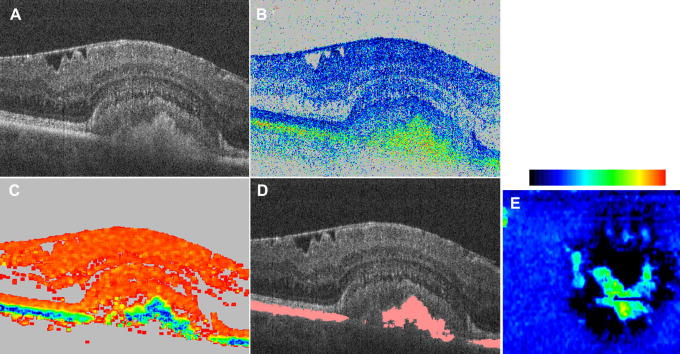
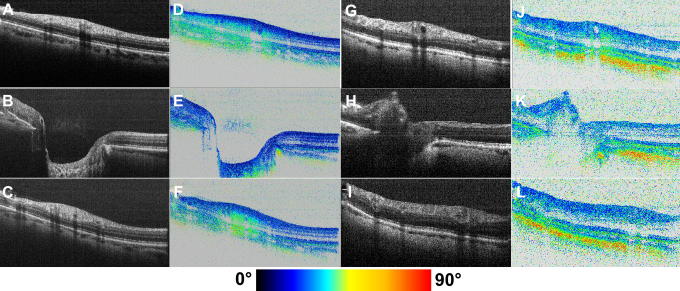
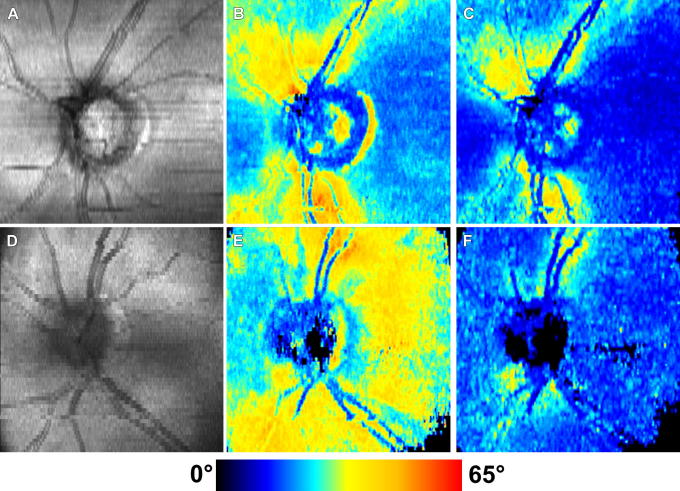
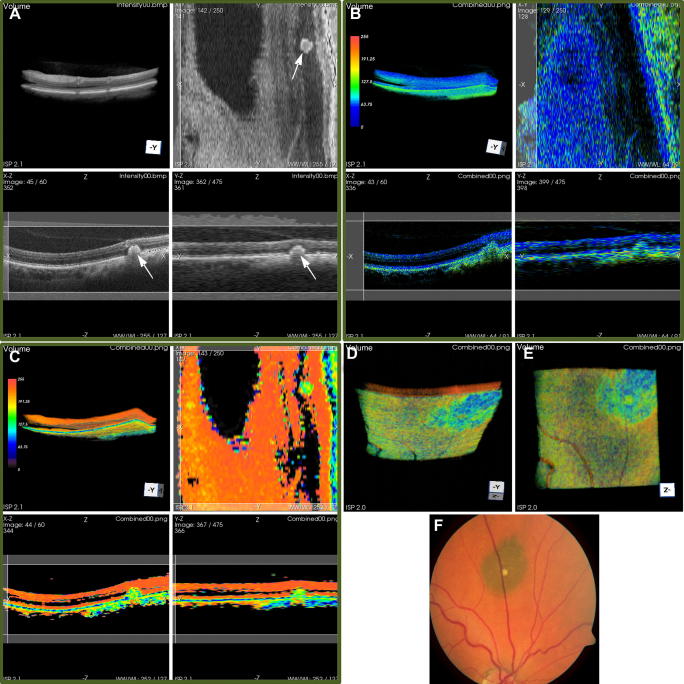
Optical coherence tomography (OCT) has become a well established imaging tool in ophthalmology. The unprecedented depth resolution that is provided by this technique yields valuable information on different ocular tissues ranging from the anterior to the posterior eye segment. Polarization sensitive OCT (PS-OCT) extends the concept of OCT and utilizes the information that is carried by polarized light to obtain additional information on the tissue. Several structures in the eye (e.g. cornea, retinal nerve fiber layer, retinal pigment epithelium) alter the polarization state of the light and show therefore a tissue specific contrast in PS-OCT images. First this review outlines the basic concepts of polarization changing light-tissue interactions and gives a short introduction in PS-OCT instruments for ophthalmic imaging. In a second part a variety of different applications of this technique are presented in ocular imaging that are ranging from the anterior to the posterior eye segment. Finally the benefits of the method for imaging different diseases as, e.g., age related macula degeneration (AMD) or glaucoma is demonstrated.


Figures

Fig. 1
Fig. 1
Schematic diagram of a polarization sensitive optical coherence tomography system. P – polarizer, BS – beam splitter, QWP – quarter wave plate, PBS – polarizing beam splitter, Det – detector, v – vertical, h – horizontal.
Fig. 2
Fig. 2
PS-OCT instrument used for clinical studies with incorporated SLO channel for patient alignment. Components: SLD, superluminescent diode. PC, polarization controller. FC, fiber coupler. POL, polarizer. PBS, polarizing beam splitter. BS, non-polarizing beam splitter. QWP, quarter wave plate. GS, galvanometer scanner. L, lens. M, mirror. ND, variable neutral density filter. DC, dispersion compensation. RM, reference mirror. HWP, half wave plate. DG, diffraction grating. LSC, line scan camera. CCTV, camera for pupil observation. (reprinted from Baumann et al. (2010)).
Fig. 3
Fig. 3
Representative B-scan of human cornea in vitro. (A) Intensity (standard OCT image), (B) retardation δ (Blue δ = 0, red δ = 90°), and (C) fast axis orientation θ (blue θ = –90°, red θ = +90°) (reprinted from Pircher et al. (2004a)).
Fig. 4
Fig. 4
En face images retrieved from the posterior surface of a human cornea in vitro. (A) retardation, (B) fast axis orientation (same color scales as in Fig. 3, reprinted from Pircher et al. (2004a)).
Fig. 5
Fig. 5
Images of keratoconus cornea. Orbscan thickness map in vivo (A) (color bar: μm), corneal thickness map derived from 3D PS-OCT data set in vitro (color bar: μm) (B), and anterior surface elevation map (color bar: μm) (C). The polarization sensitive images show a severely distorted pattern in the retardation at posterior corneal surface (D) as well as in the cumulative slow axis (deg) ∼100 μm anterior to posterior corneal surface (E). (reprinted from Götzinger et al. (2007)).
Fig. 6
Fig. 6
Images of human anterior chamber angle in vivo. (A) Intensity, (B) retardation δ (blue δ = 0, red δ = 90°), and (C) fast axis orientation θ (blue θ = −90°, red θ = +90°) (each image covers an area of 5 × 5 mm2, reprinted from Pircher et al. (2004a)).
Fig. 7
Fig. 7
PS-OCT of external ocular tissue. The intensity image is displayed on a log. scale (A). Retardation image shows strong birefringence in this tissue region (B). Color scale: blue δ = 0°, red δ = 90°. (C) Fast axis orientation. Color scale: blue θ = −90°, red θ = +90°. C: cornea, I: iris, CJ: conjunctiva, S: sclera, T: ocular tendon (reprinted from Baumann et al. (2007)).
Fig. 8
Fig. 8
Example of tissue discrimination based on PS-OCT. (A) intensity image, (B) pseudo color coded structural images. The light brown corresponds to conjunctiva, green indicates sclera, dark yellow indicates trabecular meshwork, blue indicates cornea, and red indicates uvea. (reprinted from Miyazawa et al. (2009)).
Fig. 9
Fig. 9
PS-OCT images of the fovea region of a healthy subject (left eye, reprinted from Pircher et al. (2006)). (A) Intensity image, (B) retardation image, (C) axis orientation image (horizontal axis orientation corresponds to 0°); magnified (×2) views are depicted in (D), (E) and (F). The posterior retinal layers are labeled with numbers from 1 to 4. HF: Henle’s fiber layer. Values below a certain intensity threshold are displayed in gray in (B), (C), (E), (F). (Images A, B, C consist of 3400 × 500 pixels).
Fig. 10
Fig. 10
PS-OCT images of the fovea region of a healthy volunteer (reprinted from Baumann et al. (2010)). (A) Intensity B-scan image. (B) DOPU B-scan image [color scale: DOPU = 0 (dark blue) to DOPU = 1 (red)]. Pixels with intensities below a certain threshold are displayed in gray. (C) Automatically segmented RPE (red) overlaid on the intensity image. (D) Location of ILM and RPE overlaid on reflectivity image in blue and red, respectively. (E) En face fundus image reconstructed from 3D OCT data set. (F) Retinal thickness map computed as geometric axial distance between ILM position and RPE position.
Fig. 11
Fig. 11
En face images of the fovea region in a healthy volunteer (reprinted from Baumann et al. (2009)). (A) Fundus image reconstructed from PS-OCT data set. (B) Retinal thickness map. (C) Thickness Map of segmented RPE tissue. The polarization scrambling layer (PSL) appears slightly thickened in the center of the fovea, while its thickness decreases in the periphery. (D) DOPUmin map. Values of DOPUmin increase in the periphery indicating higher depolarization of light in the center and lower depolarization in the periphery.
Fig. 12
Fig. 12
Drusen segmentation using PS-OCT (reprinted from Baumann et al. (2010)). (A, B) Intensity B-scan images. (C, D) Overlaid positions of ILM (blue), segmented RPE (red), and assumed normal RPE (green). (E) En face fundus image reconstructed from 3-D OCT data set. (F) Retinal thickness map showing the axial distance between ILM and RPE position (color map: 70–350 μm). (G) Drusen thickness map computed as axial distance between segmented RPE position and approximated normal RPE position. The color map was scaled to the maximum elevation value of 55 pixels corresponding to ∼128 μm. (H) Total retinal thickness map showing the axial distance between ILM and approximated normal RPE position (color map: 70–350 μm).
Fig. 13
Fig. 13
Example of RPE segmentation in a patient with geographic atrophy (reprinted from Baumann et al. (2010)): (A) En face fundus image reconstructed from 3D-PS-OCT data set, (B, C) intensity B-scan images, (D, E) Overlay of depolarizing structures within and outside the evaluation band (associated with the RPE and the choroid) shown in red and green color, respectively, and (F) auto-fluorescence image. (G) Map of over all number of depolarizing pixels per A-line. Zones of RPE atrophy are masked by choroidal depolarization. (H) Map displaying the thickness of the depolarizing layer associated with the RPE. (J) Binary map of atrophic zones. The color map scales from 0 to 39 pixels for (G) and (H).
Fig. 14
Fig. 14
Example of fibrosis imaged with PS-OCT (reprinted from Michels et al. (2008)). (A) Intensity (conventional) OCT image, (B) retardation and (C) Fundus image. The white line marks the approximate location of the OCT B-scan. The external limiting membrane overlying the fibrosis appears to be intact (marked with an arrow in A).
Fig. 15
Fig. 15
Different performances of RPE detection in a patient with neovascular AMD. (A) Cirrus OCT (Zeiss Meditec), (B) Spectralis OCT (Heidelberg Engineering), (C) PS-OCT. (D) Retinal thickness map (inner limiting membrane to RPE) retrieved from Cirrus OCT, (E) retinal thickness map retrieved from Spectralis OCT, (F) retinal thickness map obtained with PS-OCT (areas with RPE atrophy are marked in gray). The arrows in (C) and (F) point to locations with RPE atrophy (reprinted from Ahlers et al. (2010)).
Fig. 16
Fig. 16
Example of PS-OCT in a pseudo-vitelliform pattern dystrophy. (reprinted from Götzinger et al. (2008c)). (A) Intensity image; (B) retardation (color bar: 0°–90°); (C) DOPU (color bar: 0–1); (D) reflectivity overlaid with segmented RPE. Image size: 15° (horizontal) × 0.75 mm (vertical). (E) En face map of the thickness of segmented layer. Color bar: 0–200 μm.
Fig. 17
Fig. 17
Example of combined RNFL thickness and birefringence measurements along a circular scan around the ONH. The intensity image is plotted in the background. The RNFL is relatively thicker superiorly (S) and inferiorly (I). A similar development can be seen in the birefringence plot. The birefringence is relatively higher in the thicker areas, whereas it is lower in the thinner temporal (T) and nasal (N) areas. (Reprinted from Cense et al. (2004b)).
Fig. 18
Fig. 18
Circumpapillary PS-OCT scan from healthy human retina in vivo. Scan diameter: ∼10 deg (corresponds to a circumference of ∼9.4 mm, equal to horizontal image width; optical image depth: 1.8 mm). (A) Intensity (log scale); (B) retardation (color bar: 0°–90°); (C) optic axis orientation (color bar: 0°–180°). Orientation of scan from left to right: (S)uperior, (T)emporal, (I)nferior, (N)asal, (S)uperior. (Reprinted from Götzinger et al. (2009a)).
Fig. 19
Fig. 19
Fundus image (A), nerve fiber thickness map measured by GDx-VCC (B), en-face projection image of the OCT intensity (C), and en-face phase retardation image measured by the PS-SD-OCT (D) in a healthy eye. (Reprinted from Yamanari et al. (2008b)).
Fig. 20
Fig. 20
OCT scan (4.24 × 5.29 mm2) of the retina of a normal volunteer, centered on the ONH. (A) Integrated reflectance map; (B) birefringence map; (C) RNFL thickness map (color bar scaled in microns). (S = superior, N = nasal, I = inferior, T = temporal). (Reprinted from (Mujat et al., 2007)).
Fig. 21
Fig. 21
PS-OCT B-scan images of healthy eyes. Analysis of the origin of atypical scanning laser polarimetry retardation patterns. (A–C) Intensity images and (D–F) retardation images from eye with normal retardation pattern. (G–I) Intensity and (J–L) retardation images from eye with atypical retardation pattern. (Reprinted from Götzinger et al. (2008a)).
Fig. 22
Fig. 22
PS-OCT en-face images corresponding to Fig. 21. (A–C) Images from eyes with normal retardation patterns. (D–F) Images from eyes with atypical retardation patterns. (A, D) Intensity image (pseudo-SLO). (B, E) Retardation image including scleral signals. (C, F) Retardation image excluding scleral signals. (Reprinted from Götzinger et al. (2008a)).
Fig. 23
Fig. 23
3D PS-OCT data set of the retina of a patient with a choroidal nevus. (A) Intensity; (B) retardation (color bar: 0 = 0°, 255 = 90°); (C) DOPU (color bar: 0 = 0, 255 = 1). Figure arrangement: top left: volume rendering; top right: en face section; bottom left: horizontal B-scan; bottom right: vertical B-scan. (D) and (E) additional views of the volume rendered DOPU data set: (D) inclined upwards and (E) upwards. For better comparison with the fundus photo (F), these reverse-direction images are mirrored. Image size of OCT images: ∼14.25°(x) × 15°(y) × 1.5 mm(z, in air). (Reprinted from Götzinger et al. (2009b)).

References

    1. Ahlers C., Gotzinger E., Pircher M., Golbaz I., Prager F., Schutze C., Baumann B., Hitzenberger C.K., Schmidt-Erfurth U. Imaging of the retinal pigment epithelium in age-related macular degeneration using polarization-sensitive optical coherence tomography. Investigative Ophthalmology & Visual Science. 2010;51:2149–2157. - PMC - PubMed
    1. Ahlers C., Simader C., Geitzenauer W., Stock G., Stetson P., Dastmalchi S., Schmidt-Erfurth U. Automatic segmentation in three-dimensional analysis of fibrovascular pigmentepithelial detachment using high-definition optical coherence tomography. British Journal of Ophthalmology. 2008;92:197–203. - PubMed
    1. An L., Subhush H.M., Wilson D.J., Wang R.K. High-resolution wide-field imaging of retinal and choroidal blood perfusion with optical microangiography. Journal of Biomedical Optics. 2010;15:026011. - PMC - PubMed
    1. Anand R., Bressler S.B., Davis M.D., Ferris F.L., Klein R., Lindblad A.S., Milton R.C., Sperduto R.D., Grp, A.R.E.D.S.R Risk factors associated with age-related macular degeneration – A case-control study in the age-related eye disease study: age-Related Eye Disease Study report number 3. Ophthalmology. 2000;107:2224–2232. - PMC - PubMed
    1. Bagci A.M., Shahidi M., Ansari R., Blair M., Blair N.P., Zelkha R. Thickness profiles of retinal layers by optical coherence tomography image segmentation. American Journal of Ophthalmology. 2008;146:679–687. - PMC - PubMed

Publication types

MeSH terms