. 2011 Jul 8;146(1):53-66.
doi: 10.1016/j.cell.2011.06.006.

Glioma stem cell proliferation and tumor growth are promoted by nitric oxide synthase-2

Affiliations

Glioma stem cell proliferation and tumor growth are promoted by nitric oxide synthase-2

Christine E Eyler et al. Cell. .

Abstract

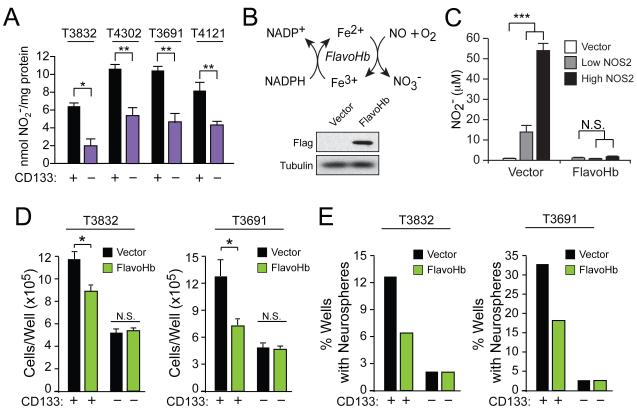
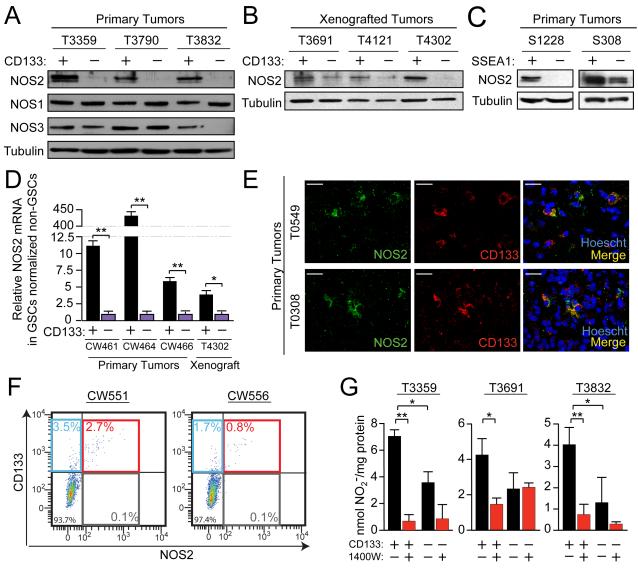
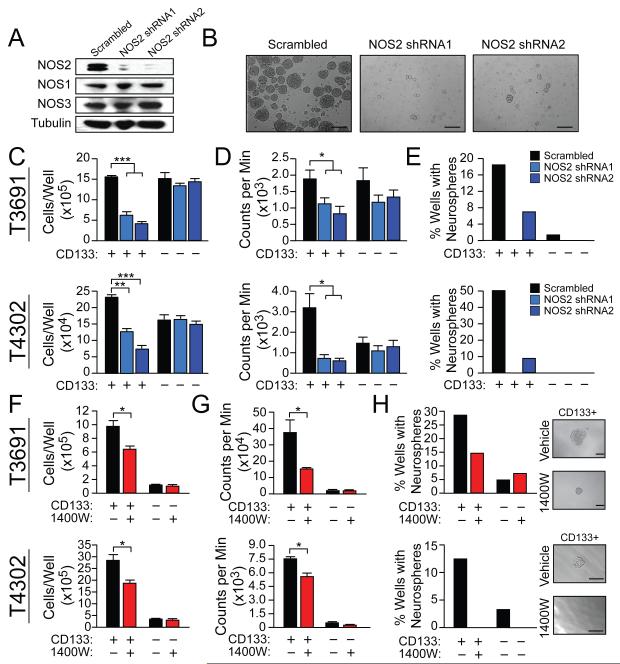
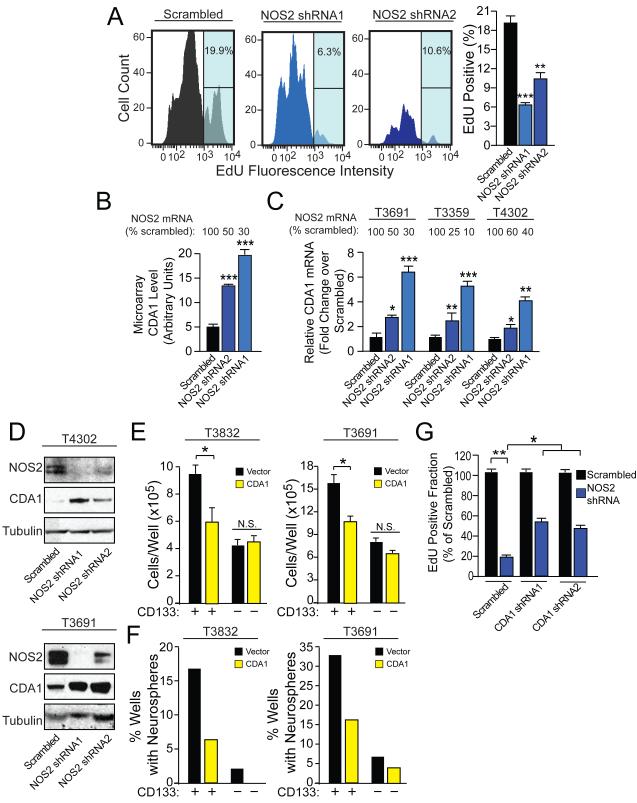
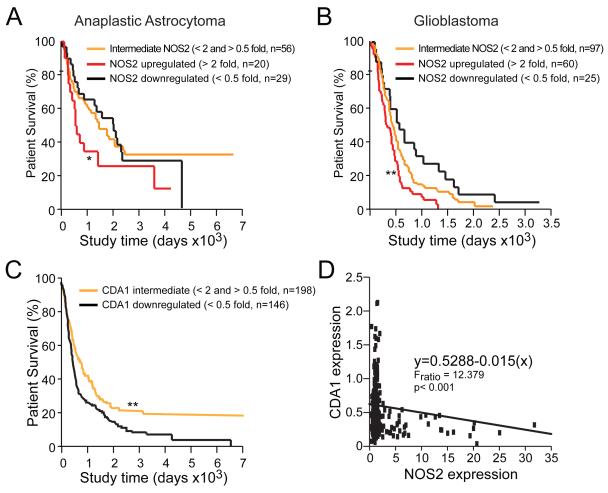
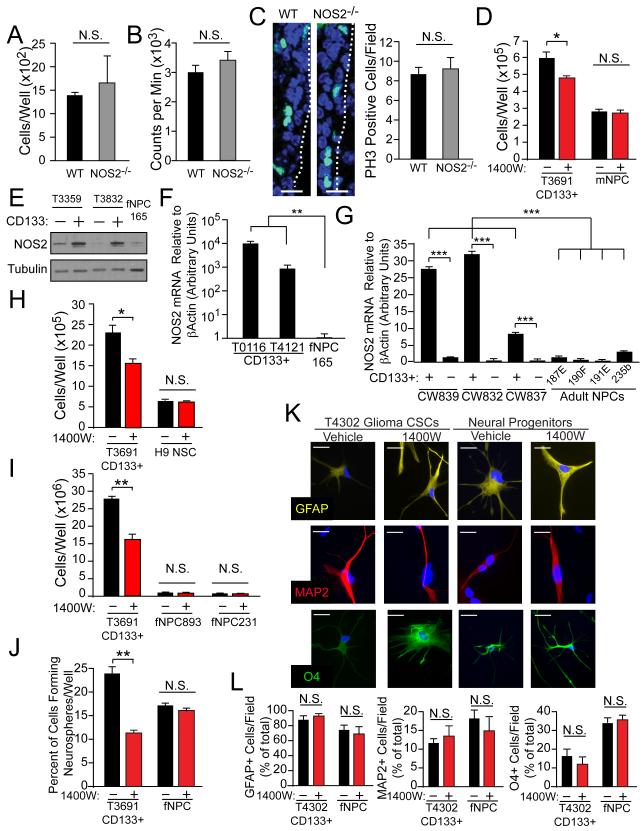
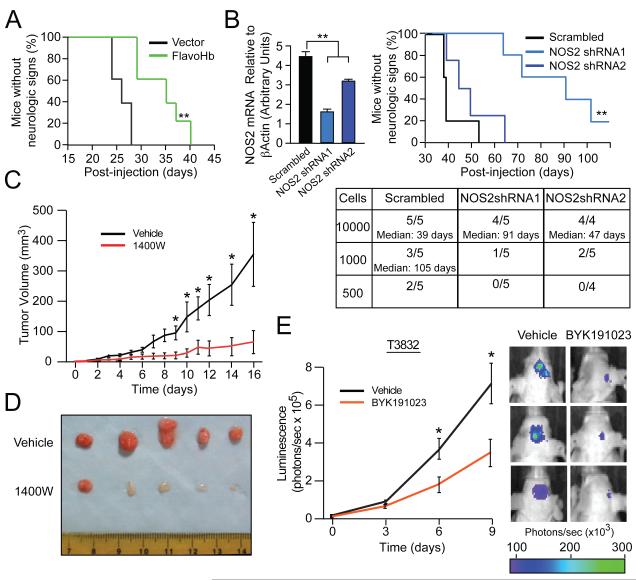
Malignant gliomas are aggressive brain tumors with limited therapeutic options, and improvements in treatment require a deeper molecular understanding of this disease. As in other cancers, recent studies have identified highly tumorigenic subpopulations within malignant gliomas, known generally as cancer stem cells. Here, we demonstrate that glioma stem cells (GSCs) produce nitric oxide via elevated nitric oxide synthase-2 (NOS2) expression. GSCs depend on NOS2 activity for growth and tumorigenicity, distinguishing them from non-GSCs and normal neural progenitors. Gene expression profiling identified many NOS2-regulated genes, including the cell-cycle inhibitor cell division autoantigen-1 (CDA1). Further, high NOS2 expression correlates with decreased survival in human glioma patients, and NOS2 inhibition slows glioma growth in a murine intracranial model. These data provide insight into how GSCs are mechanistically distinct from their less tumorigenic counterparts and suggest that NOS2 inhibition may be an efficacious approach to treating this devastating disease.


Figures

Figure 1
Figure 1. GSCs synthesize NO, and flavohemoglobin-mediated NO depletion decreases GSC growth
(A) Nitrite (NO2) was quantified in the conditioned media of glioma xenografts (T3832, T4302, T3691, T4121) sorted into CD133+ (GSC) and CD133− (non-GSC) populations, and normalized to cellular protein. (B) Microbial flavohemoglobin (FlavoHb) catalyzes the reaction of NO with oxygen to form inert nitrate (NO3). A Western blot verified Flag-tagged FlavoHb expression in GSCs. (C) FlavoHb expression in NOS2-transfected HEK293 cells decreased the total NO2 measured in media, reflecting conversion of NO to NO3. FlavoHb decreased (D) growth of xenograft-derived GSCs as measured by trypan blue exclusion and (E) GSC neurosphere formation capacity as measured 10 d after single cells were individually sorted into wells; scale bar = 50 μm. N.S., not significant; *, p<0.05; **, p<0.01; ***, p<0.001. See also Figure S1.
Figure 2
Figure 2. GSCs selectively express the NOS2 isoform, which is primarily responsible for elevated NO synthesis
Western analysis of NOS2 expression in CD133+ cells (GSCs) vs. CD133− cells (non-GSCs) in (A) primary human specimens and (B) xenografted tumors. (C) NOS2 expression levels were compared using Western analysis in GSCs versus non-GSCs isolated via SSEA1-based sorting from S1228 and S308 tumors, for which SSEA1 has been previously validated as a functional marker of GSCs. (D) GSCs and non-GSCs immediately isolated by FACS from fresh primary human brain tumors were analyzed for NOS2 mRNA by qRT-PCR. (E) Immunofluorescence of primary human tumor tissue sections revealed co-expression of CD133 and NOS2; scale bars = 25 μm. (F) Human primary malignant gliomas co-expressed NOS2 and CD133 via flow analysis immediately following isolation from fresh tissue. (G) Media from xenograft-isolated cells with or without daily treatment with 100 μM 1400W was evaluated for NO2 levels, expressed as quantities normalized to total cellular protein. *, p<0.05; **, p<0.01. See also Figure S2.
Figure 3
Figure 3. Knockdown or inhibition of NOS2 decreases GSC growth and neurosphere formation
(A) Western analysis was employed to compare the selectivity of NOS2-directed shRNAs to NOS2 relative to NOS1 or NOS3 in T3691 CD133+ cells (GSCs). (B) Representative images of neurospheres from (A); scale bar = 50 μm. Following NOS2-directed shRNA treatment of GSCs and CD133− cells (non-GSCs), (C) the number of viable cells were measured by trypan blue exclusion and (D) proliferation was measured by 3H thymidine incorporation. (E) Neurosphere formation following NOS2-directed shRNA treatment of GSCs was measured 10 d after single infected cells were individually sorted into wells. Following inhibition of NOS2 with daily administration of 100 μM 1400W to GSCs and non-GSCs, the following were measured: (F) viability by trypan blue exclusion, (G) proliferation by 3H thymidine incorporation, and (H) neurosphere formation capacity. Representative images of neurospheres assessed in (H) are displayed; scale bar = 50 μm. *, p<0.05; **, p<0.01 ***, p<0.001. See also Figure S3.
Figure 4
Figure 4. GSC cell cycle flux is supported by NOS2 activity, which modulates gene expression including the cell cycle inhibitor CDA1
(A) 5-ethynyl-2′-deoxyuridine (EdU) incorporation assay was employed to evaluate the effect of NOS2-directed shRNA on S-phase transit in CD133+ glioma cells (GSCs). (B) Microarray analysis demonstrated that NOS2-directed shRNA increased transcript expression of the cell cycle inhibitor, CDA1 (2 xenografts in duplicate). NOS2-dependent suppression of CDA1 in GSCs was validated by (C) qRT-PCR and (D) Western analysis. (E) Viability of GSCs and CD133− cells (non-GSCs) was evaluated after treatment with vector or CDA1 expressing lentivirus. F) Neurosphere formation capacity was evaluated 10 d after single vector or CDA1-overexpressing cells were sorted into wells. (G) The decreased EdU incorporation from NOS2-directed shRNAs was partially blocked by concurrent expression of CDA1-directed shRNA. *, p<0.05; **, p < 0.01; ***, p < 0.001, N.S., not significant. See also Figure S4 and Table S1.
Figure 5
Figure 5. Human glioma patient survival is correlated with characteristic NOS2 and CDA1 mRNA expression patterns
NOS2 mRNA expression inversely correlated with survival when glioma patient specimens are segregated via tumor grade to anaplastic astrocytoma (A) or GBM (B) using the REMBRANDT database; *, p<0.05; **, p<0.01 relative to all other groups. (C) Downregulation of CDA1 correlated with poor patient survival in REMBRANDT; **, p < 0.01 for decreased patient survival with downregulated CDA1 expression relative to biopsies with intermediate NOS2 expression. (D) Inverse correlation of tumor-specific NOS2 and CDA1 expression in REMBRANDT was determined using Jump8 software.
Figure 6
Figure 6. Normal mouse and human neural progenitor cells exhibit minimal NOS2-independence
(A) Viability measured by trypan blue exclusion and (B) proliferation measured by 3H thymidine incorporation was evaluated in adult wild type (WT) versus NOS2−/− mouse neural progenitor cells. (C) Immunofluorescence was used to measure phospho-histone H3 (PH3; green)-positive cells per field in the peri-ventricular region of WT and NOS2−/− littermates; dashed line - ventricular border, scale bar = 50 μm. (D) Viability by trypan blue exclusion was measured in CD133+ cells (GSCs) and mouse neural progenitors with control or daily 100 μM 1400W treatment. (E) Western analysis compared NOS2 expression in normal fetal NPCs (fNPCs) versus CD133+ GSCs and CD133− non-GSCs. NOS2 mRNA levels were determined by qRT-PCR in (F) fNPCs versus GSCs, and in (G) human adult NPCs versus GSCs and non-GSCs from fresh primary gliomas immediately post-FACS isolation. CD133-mediated enrichment for the functional properties of GSCs in these tumors was validated using neurosphere formation. The effects of daily 1400W treatment on the viability of GSCs versus (H) embryonic stem cell-derived NPCs and (I) two preparations of fNPCs. (J) Neurosphere formation of GSCs versus fNPCs was quantified after 10 d of daily 1400W treatment. Multilineage differentiation capacity with vehicle or daily 1400W treatment in GSCs and fNPCs was evaluated by staining for astrocytic (GFAP), neuronal (Tuj1), and oligodendrocytic (O4) markers, shown as (K) representative high power immunofluorescence images and (L) percent of marker positive cells per low power field; scale bar = 10 μm. *, p<0.05; **, p<0.01, ***, p<0.001, N.S., not significant. See also Figure S5.
Figure 7
Figure 7. The tumor initiation and maintenance potential of GSCs is reduced by NO depletion and NOS2 knockdown/inhibition
(A) Survival of athymic mice was tracked following intracranial implantation of 5000 CD133+ GSCs expressing either vector or FlavoHb. (B) An intracranial in vivo limiting dilution survival assay (employing 10000, 1000, 500 cells per mouse) was performed using T3691 CD133+ cells, with qRT-PCR-verified NOS2 knockdown. The table displays number of mice developing tumors and median time to neurologic signs. The survival curve displayed depicts mice injected with 10000 GSCs. (C) Tumor volumes and (D) images of GSC derived subcutaneous xenografts treated with daily intraperitoneal vehicle (n=6) or 1400W (n=6). (E) T3832 luciferase-expressing GSC-derived intracranial xenografts treated with intraperitoneal vehicle or BYK191023 (n=17/group) after engraftment and tracked by bioluminescence. Real-time images from median three animals on day 9 are shown (right). *, p<0.05; **, p<0.01. See also Figure S6.

References

    1. Alexander JH, Reynolds HR, Stebbins AL, Dzavik V, Harrington RA, Van de Werf F, Hochman JS. Effect of tilarginine acetate in patients with acute myocardial infarction and cardiogenic shock: the TRIUMPH randomized controlled trial. JAMA. 2007;297:1657–1666. - PubMed
    1. Androutsellis-Theotokis A, Leker RR, Soldner F, Hoeppner DJ, Ravin R, Poser SW, Rueger MA, Bae SK, Kittappa R, McKay RD. Notch signalling regulates stem cell numbers in vitro and in vivo. Nature. 2006;442:823–826. - PubMed
    1. Avontuur JA, Nolthenius R.P. Tutein, van Bodegom JW, Bruining HA. Prolonged inhibition of nitric oxide synthesis in severe septic shock: a clinical study. Crit Care Med. 1998;26:660–667. - PubMed
    1. Bakshi A, Nag TC, Wadhwa S, Mahapatra AK, Sarkar C. The expression of nitric oxide synthases in human brain tumours and peritumoral areas. J Neurol Sci. 1998;155:196–203. - PubMed
    1. Bao S, Wu Q, McLendon RE, Hao Y, Shi Q, Hjelmeland AB, Dewhirst MW, Bigner DD, Rich JN. Glioma stem cells promote radioresistance by preferential activation of the DNA damage response. Nature. 2006a;444:756–760. - PubMed

Publication types

Associated data

Grants and funding