. 2011 Jul 8;146(1):148-63.
doi: 10.1016/j.cell.2011.05.040.

Biomechanical remodeling of the microenvironment by stromal caveolin-1 favors tumor invasion and metastasis

Affiliations

Biomechanical remodeling of the microenvironment by stromal caveolin-1 favors tumor invasion and metastasis

Jacky G Goetz et al. Cell. .

Abstract

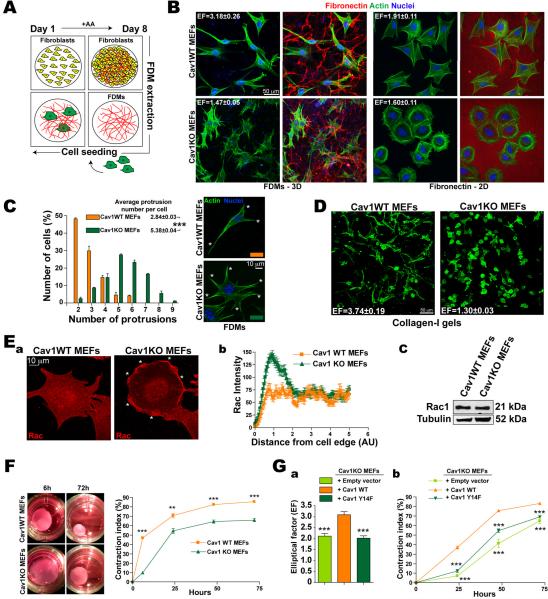
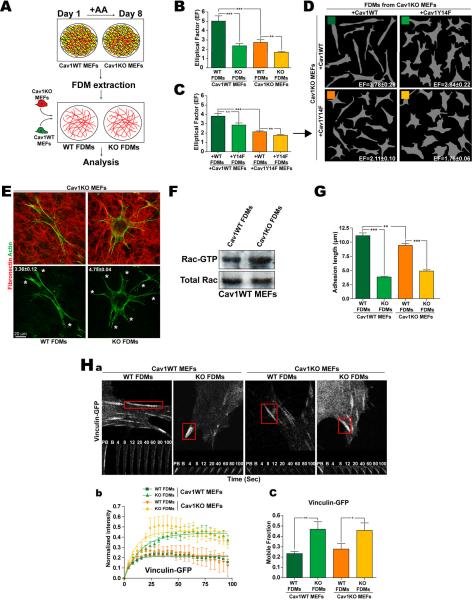
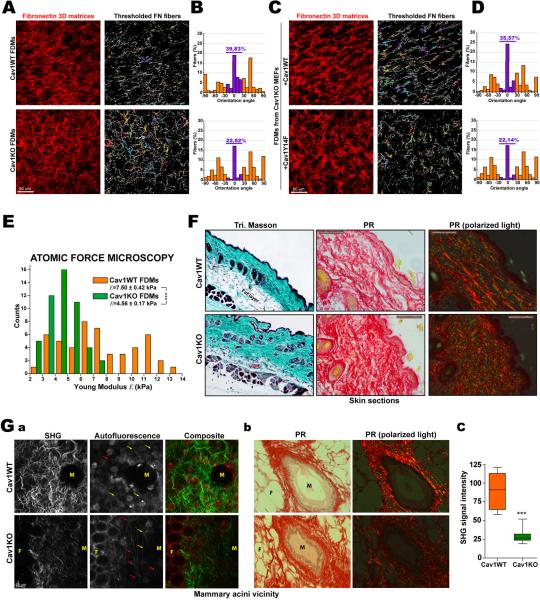
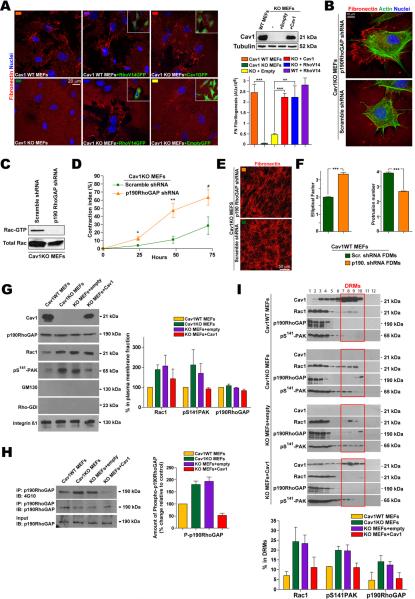
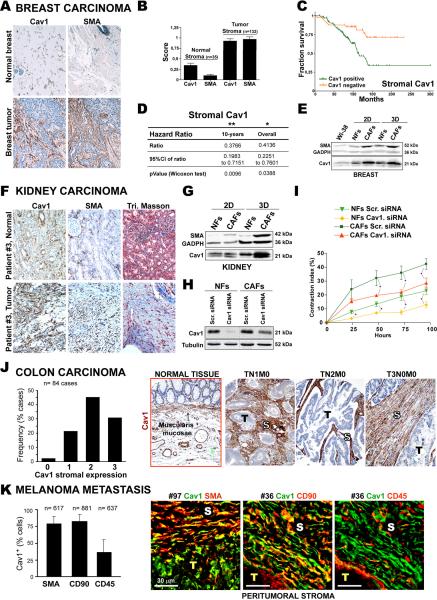
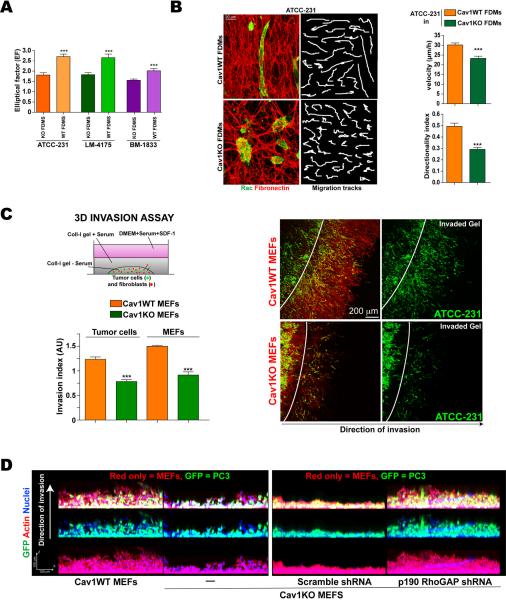
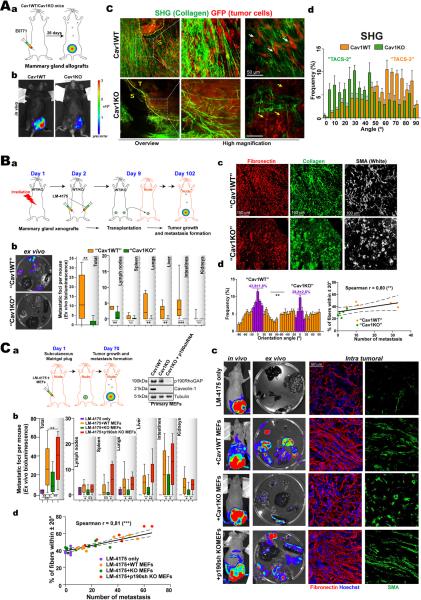
Mechanotransduction is a key determinant of tissue homeostasis and tumor progression. It is driven by intercellular adhesions, cell contractility, and forces generated within the microenvironment and is dependent on extracellular matrix composition, organization, and compliance. We show that caveolin-1 (Cav1) favors cell elongation in three-dimensional cultures and promotes Rho- and force-dependent contraction, matrix alignment, and microenvironment stiffening through regulation of p190RhoGAP. In turn, microenvironment remodeling by Cav1 fibroblasts forces cell elongation. Cav1-deficient mice have disorganized stromal tissue architecture. Stroma associated with human carcinomas and melanoma metastases is enriched in Cav1-expressing carcinoma-associated fibroblasts (CAFs). Cav1 expression in breast CAFs correlates with low survival, and Cav1 depletion in CAFs decreases CAF contractility. Consistently, fibroblast expression of Cav1, through p190RhoGAP regulation, favors directional migration and invasiveness of carcinoma cells in vitro. In vivo, stromal Cav1 remodels peri- and intratumoral microenvironments to facilitate tumor invasion, correlating with increased metastatic potency. Thus, Cav1 modulates tissue responses through force-dependent architectural regulation of the microenvironment.


Figures

Figure 1
Figure 1. Cav1 regulated contractility controls matrix-induced cell morphology and reciprocal interaction with the 3D microenvironment
(A) FDMs were generated from NIH-3T3 cells cultured with daily ascorbic acid (AA) supplement. (B) Cav1WT and KO MEFs were plated (4h) on NIH-3T3 FDMs (3D) or FN (5μg/ml, 2D) and labeled as indicated. Elliptical factors (EF) were calculated. (C) Quantification of protrusions per cell (means indicated). Representative Cav1WT and Cav1KO cells (asterisks mark protrusions). (D) Cav1WT and KO MEFs were embedded (6h) in Col-I gels (1mg/ml). EFs are indicated. (E) Rac1 distribution in Cav1WT and KO MEFs. (a) Rac1 immunostaining in cells plated (4h) on FN. Asterisks mark Rac1 foci. (b) Rac1 pixel intensity from the cell edge to the nucleus (c) Immunoblot showing total Rac1 expression. (F) Gel contraction by Cav1WT and KO MEFs embedded in Col-I gels. (G) Cav1-dependent cell elongation (a) and gel contraction (b) require Cav1-Tyr14.
Figure 2
Figure 2. Cav1-dependent extracellular environment regulates cell shape, protrusion number, Rac1 activity and maturation of integrin-dependent adhesions
(A) FDMs were generated from Cav1WT and KO MEFs (or KO MEFs rescued with Cav1WT or CavY14F) and seeded with unmodified or reconstituted MEFs as indicated. (B) EFs of Cav1WT and KO MEFs seeded in the indicated FDMs. (C) EFs of Cav1KO MEFs rescued by reexpression (+) of Cav1WT or CavY14F and seeded in FDMs generated by similarly-rescued Cav1KO MEFs. (D) Representative Metamorph masks from experiments as in C, with calculated EFs. (E) Representative Cav1KO MEFS seeded in Cav1WT or Cav1KO FDMs; average protrusions per cell are shown. (F) Rac-GTP levels and total Rac expression in Cav1WT MEFs seeded in Cav1WT or KO FDMs. (G) Length of integrin-dependent adhesions (indicated by 9EG7 staining). (H) FRAP analysis of vinculin-GFP–labeled adhesions in transfected cells seeded in the indicated FDMs. (a) Time-lapse sequences showing corresponding regions before photobleaching (PB), immediately after photobleaching (B) and during recovery. (b) Quantification of vinculin-GFP fluorescence recovery for each condition. (c) Percentage of recovery (boxed areas in a) showing the size of the mobile vinculin-GFP fraction. Data are representative of 3 independent experiments (6≤adhesions≤15).
Figure 3
Figure 3. Cav1 promotes patterning and stiffness of 3D matrices, and favors normal tissue architecture
(A–D) FDMs were generated and after cell extraction were fixed and labeled. The orientation of all thresholded FN fibers was quantified and plotted against the modal angle (set at 0°). (E) Atomic force microscopy was used to plot point-by-point force versus distance along fibers. The chart shows quantification of Young modulus. (F) Skin sections of WT and Cav1KO mice stained with Masson's trichrome and picrosirius red (PR). Polarized light highlights fibrillar collagen. (G) Stromal organization in WT and Cav1KO mammary gland. (a) Multiphoton excitation microscopy coupled to second harmomic generation imaging (MPE-SHG) of intact fixed glands; SHG and autofluorescence signals are shown. Red and yellow arrows mark curled and straight collagen fibers devoid of SHG signal. (b) Mammary gland sections from WT and Cav1KO mice stained as in F. M=Mammary gland, F=Fat cell. (c) Quantification of SHG signal intensity as in a.
Figure 4
Figure 4. Cav1 promotes force-dependent microenvironment remodeling via Rho-GTPase activation
(A) Indicated MEFs expressing GFP-tagged WT Cav1, RhoV14 or empty vector (see immunoblot) were plated on FN (24h). FN remodeling was quantified by thresholding for bright FN fibrils. (B) Cav1KO MEFs stably expressing scrambled or p190 shRNA were plated as in A and analyzed for (C) Rac1-GTPase activity and (D) Col-I gel contraction. (E) FN staining of FDMs generated from the indicated MEFs. (F) EF (left) and average protrusion number (right) of Cav1WT MEFs seeded on FDMs generated as in E. (G) Immunoblot analysis of purified PM fractions from the indicated MEFs. Quantified and protein levels are plotted relative to Cav1WT MEFs. (H) p190 was immunoprecipitated from samples prepared as in G, and probed for p190 and phosphotyrosine (4G10). Chart shows quantification of phosphorylated p190. (I) The indicated MEFs were fractioned, and immunoblot signals in DRM fractions quantified and plotted.
Figure 5
Figure 5. Stroma of human breast, kidney and colon carcinomas and melanoma metastases are enriched in Cav1-expressing fibroblasts
(A) Representative images of normal and breast cancer tissue stained for Cav1 and SMA. (B) Staining scores for Cav1 and SMA in normal (n=35) and tumor (n=132) tissues. (C) Kaplan-meier curve of progression-free survival for patients sorted by stromal Cav1-expression. (D) Multivariate survival results for Cav1-positive and negative stroma. (E) Fibroblasts from normal breast tissue (NFs) and tumor tissue (CAFs) were isolated and cultured as indicated. Immunoblot shows Cav1 and SMA expression. (F) Paired sections of normal kidney and renal tumor tissue stained for Cav1 and SMA. Collagen deposition was assessed by Masson's trichrome staining. (G) NFs and CAFs from normal kidney and renal tumor tissue of the same patient were isolated, cultured as indicated, and Cav1 and SMA expression was assessed. (H) NFs and CAFs were infected with lentivirus expressing scrambled or Cav1 siRNA and Cav1 expression assessed. (I) Col-I gel contraction by NFs and CAFs infected as in H. (J) Sections of normal colon and colorectal tumor tissue from 84 patients were stained for Cav1. Images are representative of control tissue and colorectal carcinoma with strong stromal Cav1. S=stroma, T=tumor. Chart shows percentage of cases classified according to Cav1 intensity from 0=low (control tissue) to 3=strong. (K) Cav1, SMA, CD90 and CD45 expression in melanoma metastases. Images show colocalization analysis of Cav1 with SMA, CD90 and CD45.
Figure 6
Figure 6. Cav1-dependent 3D microenvironment stimulates TC migration and invasion in vitro
(A) EFs of ATCC-231, LM-4175 and BM-1833 metastatic cells seeded in Cav1WT or Cav1KO FDMs. (B) ATCC-231 cells grown in the indicated FDMs (6h) were monitored for 12h. Samples were labeled for Rac and FN to reveal cell morphology and FDM structure. Example migration tracks are depicted. Charts show quantification of cell velocity and directionality. (C) Col-I gels containing pre-labeled TCs and MEFs were placed under cell-free gel (scheme) and 3D TC invasion was quantified. Actin staining (red) allowed distinction of MEFs (red only) from TCs (green). (D) GFP-expressing PC3 prostate TCs were seeded in Matrigel with the indicated MEFs and cultured for 6 days. Cells were fixed and stained as indicated.
Figure 7
Figure 7. Cav1-dependent 3D microenvironment stimulates in vivo tumor cell invasion and increases metastatic potency
(A) Orthotopic mammary gland allografts. (a) Experimental scheme. (b) Bioluminescence detection of TCs (representative images). Color scale depicts the photon flux (photons per second). (c) MPE-SHG of primary tumor explants. White and yellow arrows mark invading and encapsulated TCs. (d) Quantification of the angle of collagen fibers to the tumor boundary by SHG. (B) Orthotopic mammary gland xenografts and tumor transplantation in nude mice. (a) Experimental scheme. (b) Representative extracted organs (left). Ex vivo quatification of the distribution of total and organ-specific metastatic foci (right). (c) Immunostaining of extracted tumors as indicated. (d) Quantification of intratumoral orientation of FN fibers plotted against the modal angle (set at 0°, left). Correlation analysis (right). (C) Subcutaneous Matrigel injection of LM-4175 TCs plus the indicated pMEFs. (a) Experimental scheme. Immunoblot shows efficiency of p190 silencing and Cav1 expression. (b) Distribution of total and individual metastatic foci (ex vivo, day 70). (c) Representative images of primary tumors in vivo, extracted organs ex vivo and immunostained tumors. (d) Correlation analysis.

Comment in

References

    1. Amatangelo MD, Bassi DE, Klein-Szanto AJ, Cukierman E. Stroma-derived three-dimensional matrices are necessary and sufficient to promote desmoplastic differentiation of normal fibroblasts. Am J Pathol. 2005;167:475–488. - PMC - PubMed
    1. Bershadsky AD, Balaban NQ, Geiger B. Adhesion-dependent cell mechanosensitivity. Annual Review of Cell and Developmental Biology. 2003;19:677–695. - PubMed
    1. Bhowmick NA, Neilson EG, Moses HL. Stromal fibroblasts in cancer initiation and progression. Nature. 2004;432:332–337. - PMC - PubMed
    1. Bustos RI, Forget MA, Settleman JE, Hansen SH. Coordination of Rho and Rac GTPase function via p190B RhoGAP. Curr Biol. 2008;18:1606–1611. - PMC - PubMed
    1. Cerezo A, Guadamillas MC, Goetz JG, Sanchez-Perales S, Klein E, Assoian RK, Del Pozo MA. Absence of Caveolin-1 Increases Proliferation and Anchorage-Independent Growth by a Rac-Dependent, Erk-Independent Mechanism. Mol Cell Biol. 2009 - PMC - PubMed

Publication types