. 2011 Oct 1;20(19):3822-30.
doi: 10.1093/hmg/ddr300. Epub 2011 Jul 5.

Modifier genes and non-genetic factors reshape anatomical deficits in Zfp423-deficient mice

Affiliations

Modifier genes and non-genetic factors reshape anatomical deficits in Zfp423-deficient mice

Wendy A Alcaraz et al. Hum Mol Genet. .

Abstract

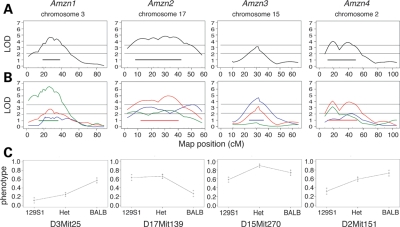
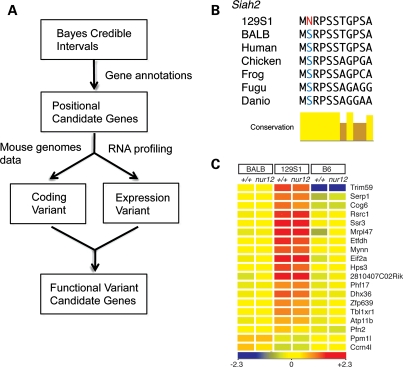
Development of neural circuitry depends on the integration of signaling pathways to coordinate specification, proliferation and differentiation of cell types in the right number, in the right place, at the right time. Zinc finger protein 423 (Zfp423), a 30-zinc finger transcription factor, forms alternate complexes with components of several developmental signaling pathways, suggesting it as a point of signal integration during brain development. We previously showed that mice lacking Zfp423 have reduced proliferation of cerebellar precursor cells, resulting in complete loss of vermis and variable hypoplasia of cerebellar hemispheres. Here, we show that Zfp423(-/-) hemisphere malformations are shaped by both genetic and non-genetic factors, producing distinct phenotype distributions in different inbred genetic backgrounds. In genetic mapping studies, we identify four additive modifier loci (Amzn1-4) and seven synthetically interacting loci (Smzn1.1-3.1) that together explain approximately one-third of the phenotypic variance. Strain-specific sequence polymorphism and expression data provide a reduced list of functional variant candidate genes at each modifier locus. Environmental covariates add only modest explanatory power, suggesting an additional stochastic component. These results provide a comprehensive analysis of sources of phenotype variation in a model of hindbrain malformation.


Figures

Figure 1.
Figure 1.
Variation in Zfp423nur12/nur12 cerebellar hypoplasia within and between strain backgrounds. (A) Schematic view of cerebellar phenotypes with vermis in purple, hemispheres in green. Phenotype 1, no cerebellum; 2, rudimentary cerebellar tissue; 3, foliated hemispheres separated from the midline; and 4, foliated hemispheres joined at the midline. (B) Representative photographs of brains from each class. (C) Histograms show distributions of cerebellar phenotypes for Zfp423nur12/nur12 on congenic BALB (n= 47) and 129S1 (n= 36) strain backgrounds. Observed numbers are indicated above each bar. The difference is highly significant by Fisher's exact test (P= 2.72 × 10⁵).
Figure 2.
Figure 2.
Significant linkage in 129S1 × BALB-nur12 F2 intercross. (A) Non-parametric linkage for categorical trait model identifies loci on chromosomes 2, 3 and 17 above genome-wide threshold. (B) Dichotomous trait models recapitulate categorical linkage peaks, identify additional linkage peaks on chromosomes 12 and 15 and substantially increase the LOD score on chromosome 3. Dichotomous trait 1 in blue, trait 2 in red and trait 3 in green. Significance of the linkage on chromosome 15 survives correction for testing four phenotype models, while the peak on chromosome 12 does not. Top line in each panel represents significant LOD score (genome-wide P< 0.05) and bottom line represents suggestive LOD score (P< 0.63), determined empirically by 10 000 permutations of the data.
Figure 3.
Figure 3.
Four Amzn loci with divergent effects. (A) Refined linkage statistics with added markers for Amzn1–4 for categorical phenotype. (B) Linkage scores for dichotomous models. Dichotomous trait 1 in blue, trait 2 in red and trait 3 in green. Ninety-five percent BCIs are represented by color-coded bars below each peak. In both (A) and (B), top line represents genome-wide significant and bottom line represents suggestive LOD scores, determined empirically by 10 000 permutations of the data. (C) Effect plots show bias toward hemispheres with BALB alleles at three of the four major effect loci. The 129S1 allele is incompletely dominant at Amzn1, 129S1 is dominant at Amzn2 and BALB is dominant at Amzn3 and Amzn4.
Figure 4.
Figure 4.
Covariate interactions with Amzn loci. (A and B) Two-dimensional linkage scan identifies additive effects (A), but no interactive effects (B) on nur12 phenotypes. Heat maps indicate two-dimensional LOD scores indicated by the color bar to the right of each plot. (A) Upper triangle, LODa, score for the additive QTL model; lower triangle, LODav1, score for the additive model compared with the single QTL model, assuming no epistasis. (B) Upper triangle, LODi, interactive model for epistasis; lower triangle, LODfv1, full QTL model, allowing for epistasis, compared with the single QTL model. (CG) One-dimensional scans using each Amzn locus as a covariate identifies synthetically interacting loci. (C and D) For the categorical phenotype, significant interactions are seen with (C) Amzn1 (chromosome 2; LOD = 3.46, P= 0.016) and with (D) Amzn2 (chromosome 13; LOD = 3.42, P= 0.033) as the covariate. (E) For dichotomous trait 1, Amzn3 shows a significant interaction with chromosome 2 (LOD = 3.40, P= 0.044). (F) For trait 2, Amzn2 shows interactions with chromosomes 2 (LOD = 3.50, P= 0.029), 13 (LOD = 3.25, P= 0.048) and 14 (LOD = 3.30, P= 0.044). (G) For trait 3, Amzn1 interacts with chromosome 7 (LOD = 3.40, P= 0.033). Top line represents significant LOD score (P< 0.05), bottom line suggestive LOD score (P< 0.63), determined empirically by 10 000 permutations of the data.
Figure 5.
Figure 5.
Candidate functional variants within Amzn loci. (A) Schematic for prioritization of Amzn candidate genes. Application of this scheme to the four Amzn loci identified 415 out of 2614 genes with high probability functional variants. (B) Siah2 variant in 129S1 is a non-conservative substitution at a highly conserved residue. (C) Heat map of strain-dependent expression levels for the 19 genes at Amzn1 identified as having 129S1-specific expression level significantly different from both BALB/c and B6. Each column represents average of three samples, with each sample comprising cerebella from three embryos. Color bar indicates normalized expression values; with red indicating higher and blue lower expression.

References

    1. Sillitoe R.V., Joyner A.L. Morphology, molecular codes, and circuitry produce the three-dimensional complexity of the cerebellum. Ann. Rev. Cell Dev. Biol. 2007;23:549–577. - PubMed
    1. Herrup K., Murcia C., Gulden F., Kuemerle B., Bilovocky N. The genetics of early cerebellar development: networks not pathways. Prog. Brain Res. 2005;148:21–27. - PubMed
    1. Wang V.Y., Zoghbi H.Y. Genetic regulation of cerebellar development. Nat. Rev. Neurosci. 2001;2:484–491. - PubMed
    1. Goldowitz D., Hamre K. The cells and molecules that make a cerebellum. Trends Neurosci. 1998;21:375–382. - PubMed
    1. Ten Donkelaar H.J., Lammens M. Development of the human cerebellum and its disorders. Clin. Perinatol. 2009;36:513–530. - PubMed

Publication types