. 2011 Jul 19;108(29):E332-40.
doi: 10.1073/pnas.1105105108. Epub 2011 Jul 5.

Evolution of the V, D, and J gene segments used in the primate gammadelta T-cell receptor reveals a dichotomy of conservation and diversity

Affiliations

Evolution of the V, D, and J gene segments used in the primate gammadelta T-cell receptor reveals a dichotomy of conservation and diversity

Allison R Kazen et al. Proc Natl Acad Sci U S A. .

Abstract

γδ T cells are an immunological enigma in that both their function in the immune response and the molecular mechanisms behind their activation remain unclear. These cells predominate in the epithelia and can be rapidly activated to provide an array of responses. However, no homologous γδ T-cell populations have been identified between humans and mice, and our understanding of what these cells recognize as ligands is limited. Here we take an alternative approach to understanding human γδ T-cell ligand recognition by studying the evolutionary forces that have shaped the V, D, and J gene segments that are used during somatic rearrangement to generate the γδ T-cell receptor. We find that distinctly different forces have shaped the γ and δ loci. The Vδ and Jδ genes are highly conserved, some even through to mouse. In contrast, the γ-locus is split: the Vγ9, Vγ10, and Vγ11 genes represent the conserved region of the Vγ gene locus whereas the remaining Vγ genes have been evolving rapidly, such that orthology throughout the primate lineage is unclear. We have also analyzed the coding versus silent substitutions between species within the V and J gene segments and find a preference for coding substitutions in the complementarity determining region loops of many of the V gene segments. Our results provide a different perspective on investigating human γδ T-cell recognition, demonstrating that diversification at particular γδ gene loci has been favored during primate evolution, suggesting adaptation of particular V domains to a changing ligand environment.


Conflict of interest statement

The authors declare no conflict of interest.

Figures

Fig. 1.
Fig. 1.
Genomic organization of the V, D, and J gene segments comprising the primate γδ TCR: (A) Vδ, (B) Jδ and Dδ, (C) Vγ and (D) Jγ from humans, Pan troglodytes (Patr), Pongo pygmaeus (Popy), Macaca mulatta (Mamu), and Callithrix jacchus (Caja). V and J genes are shown as arrows to indicate coding direction. D segments are shown as blocks. Functional genes are shown in black, pseudogenes in gray. Scale for each locus is shown in the upper right of each section. Insertions and deletions are indicated as gray triangles with insertions shown as pluses and deletions as minuses, with distances in kilobases.
Fig. 2.
Fig. 2.
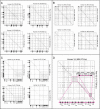
Dot-plot analysis reveals a dichotomy of genomic evolution between the δ- and γ-loci. Dotplot analysis was applied to the genomic regions encoding the Vδ (A), Vα (B), Vγ (C), and Vβ (D) genes between humans, P. troglodytes (Patr), P. pygmaeus (Popy), M. mulatta (Mamu), and C. jacchus (Caja) to determine the relative stability of these regions across primate evolution. The relative positions of the V genes are shown with arrows, with black indicating functional genes and gray pseudogenes. Black dots on the plot correspond to regions with greater than 90% identity. Gray dots indicate greater than 80% identity between the two regions being compared. The position of the Vδ5 gene from P. pygmaeus is uncertain, indicated by a box. The size of the regions compared are shown in base pairs after the species name. In D, pink boxes indicate the nature of the genes located in regions of repetitive sequences.
Fig. 3.
Fig. 3.
Phylogenetic relationships of the primate V, D, and J gene segments. Shown are neighbor-joining trees of Vδ (A), Vγ (B), Jδ (C), and Jγ (D). Bootstrap confidence values are shown for most branches. Well supported groupings are indicated by colored shading. Identical sequences are enclosed in boxes. A scale for distance is shown in the lower right of each tree.
Fig. 4.
Fig. 4.
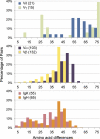
Vδ and Vγ domains exhibit high levels of amino acid diversity. Shown are histograms of pairwise amino acid differences: Vδ (blue) and Vγ (green; Top), Vα (purple) and Vβ (yellow; Middle), and IgK (pink) and IgH (orange; Bottom). The numbers of sequences used in this analysis are shown to the right of the legend labels. All sequences available (including allelic forms) were included in this analysis.
Fig. 5.
Fig. 5.
Coding (dn) versus silent (ds) mutations are unequally distributed across the Vδ and Vγ genes. (A) Average dn (green) and ds (yellow) substitutions per site across the primate species are shown for the Vδ, Vγ, Jγ, and Jδ genes. Average substitutions per site were calculated for the regions encoding the CDR1 loop (1), CDR2 loop (2), framework region (F), and the entire coding region (V) for the variable genes and for the entire coding region of the J gene segments. Error bars represent SE of these averages. (B) Ratio of dn to ds substitutions for each region calculated in A. A ratio of 1, indicated as a dashed purple line in each plot, is consistent with neutral selection. Significant values greater than this are consistent with diversifying selection. Those lower than this are consistent with purifying selection. CDR1 and -2 loop regions are colored in red, framework in orange, and V domain in purple. For those values at which ds is 0, ratios are shown extending to the maximum value of 4 with a plus sign. (Significant at *P ≤ 0.05, **P ≤ 0.005.)
Fig. 6.
Fig. 6.
Diversity of the Dδ segments across primate species. Translations of the Dδ segments are shown relative to the human consensus. Reading frames are shown at the top in the forward or reverse orientation. Dashes indicate identity with the human consensus, and differences are shown as single amino acid abbreviation. (*Stop codons; Dδ segments that have insertions or deletions relative to human.) Segments deemed potentially nonfunctional are shaded lavender.
Fig. P1.
Fig. P1.
TCRs are made through the process of genetic rearrangement of V, D, and J gene segments. Left: representation of V–D–J recombination to produce the δ-chain (Top) and V–J recombination to produce the γ-chain (Bottom). Regions encoding the CDR1 and CDR2 loops are colored yellow and orange, respectively. The CDR3 loop region is boxed in red. Right: Ribbon representation of a γδ TCR (G8) showing the location of the CDR1 (yellow), CDR2 (orange), and CDR3 (red) loops and their potential for antigen recognition.

References

    1. Bonneville M, O'Brien RL, Born WK. Gammadelta T cell effector functions: a blend of innate programming and acquired plasticity. Nat Rev Immunol. 2010;10:467–478. - PubMed
    1. Havran WL, Jameson JM. Epidermal T cells and wound healing. J Immunol. 2010;184:5423–5428. - PMC - PubMed
    1. Nedellec S, Bonneville M, Scotet E. Human Vgamma9Vdelta2 T cells: from signals to functions. Semin Immunol. 2010;22:199–206. - PubMed
    1. Adams EJ, Chien YH, Garcia KC. Structure of a gammadelta T cell receptor in complex with the nonclassical MHC T22. Science. 2005;308:227–231. - PubMed
    1. Shin S, et al. Antigen recognition determinants of gammadelta T cell receptors. Science. 2005;308:252–255. - PubMed

Publication types

Substances

LinkOut - more resources