. 2011 Jul 5;11(8):10.1167/11.8.1 1.
doi: 10.1167/11.8.1.

The dependence of crowding on flanker complexity and target-flanker similarity

Affiliations

The dependence of crowding on flanker complexity and target-flanker similarity

Jean-Baptiste Bernard et al. J Vis. .

Abstract

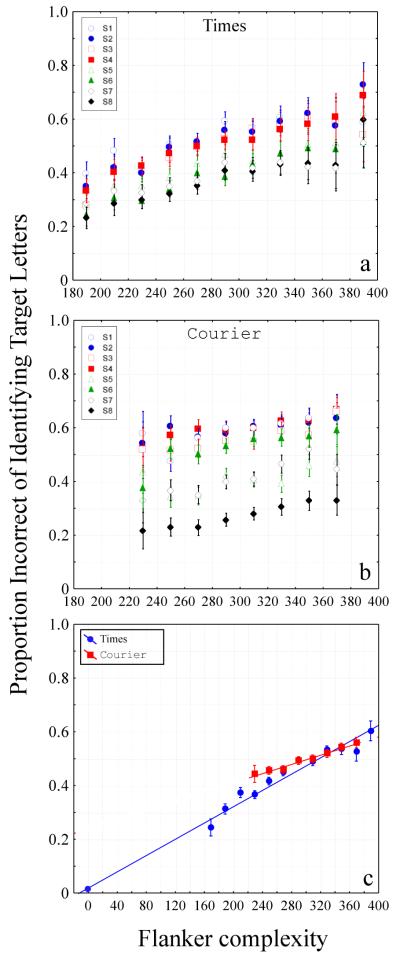
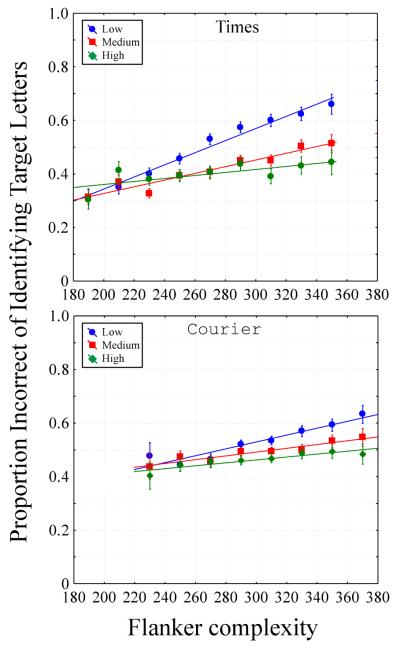
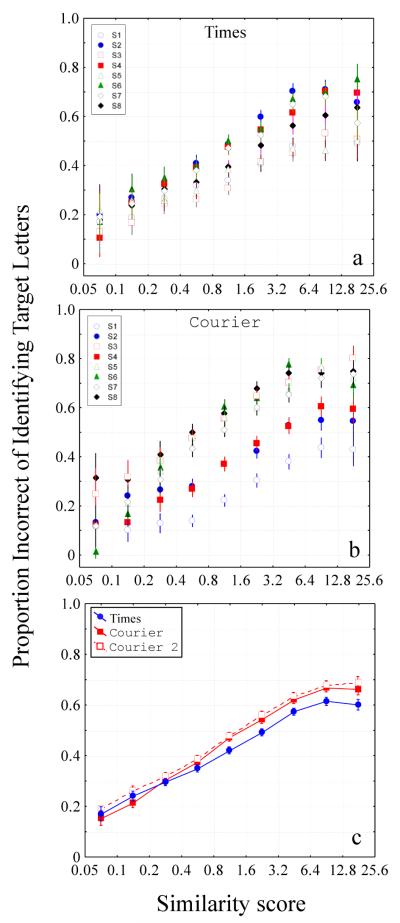
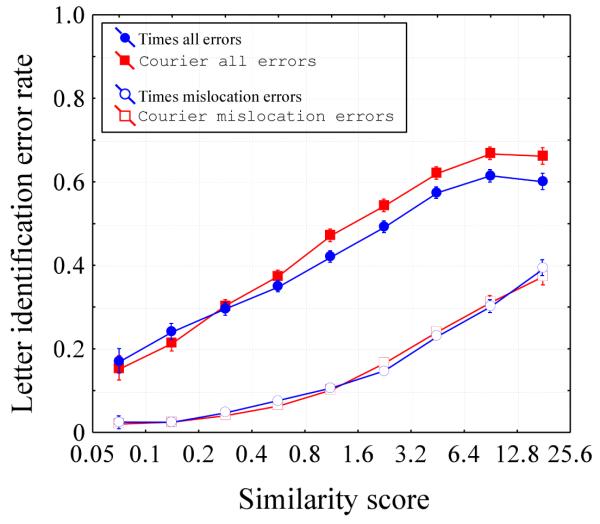
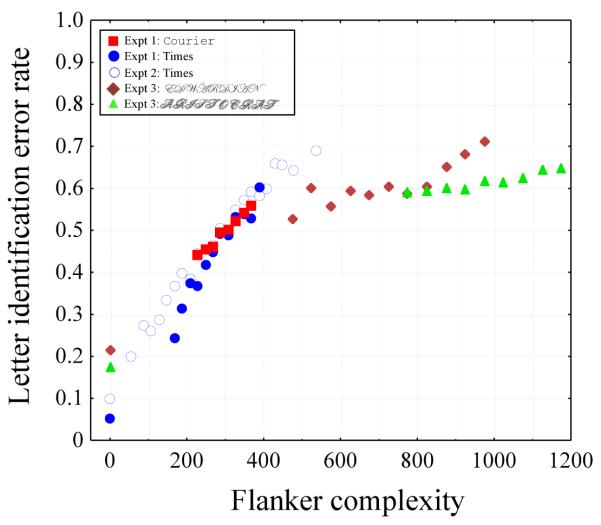
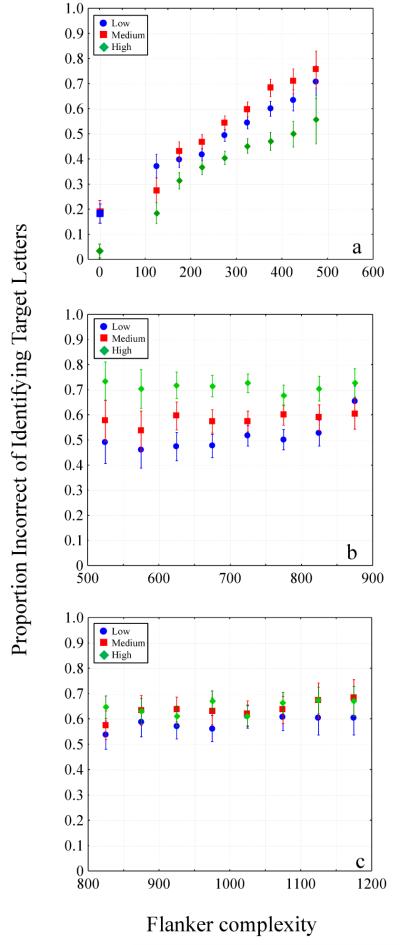
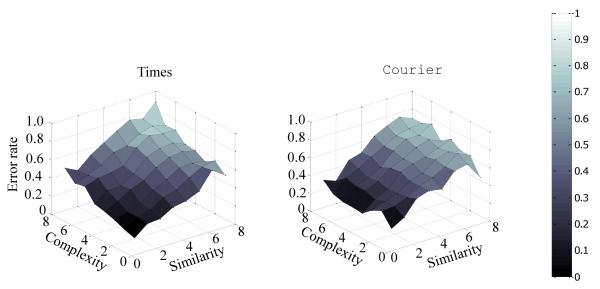
We examined the effects of the spatial complexity of flankers and target-flanker similarity on the performance of identifying crowded letters. On each trial, observers identified the middle character of random strings of three characters ("trigrams") briefly presented at 10° below fixation. We tested the 26 lowercase letters of the Times Roman and Courier fonts, a set of 79 characters (letters and non-letters) of the Times Roman font, and the uppercase letters of two highly complex ornamental fonts, Edwardian and Aristocrat. Spatial complexity of characters was quantified by the length of the morphological skeleton of each character, and target-flanker similarity was defined based on a psychometric similarity matrix. Our results showed that (1) letter identification error rate increases with flanker complexity up to a certain value, beyond which error rate becomes independent of flanker complexity; (2) the increase of error rate is slower for high-complexity target letters; (3) error rate increases with target-flanker similarity; and (4) mislocation error rate increases with target-flanker similarity. These findings, combined with the current understanding of the faulty feature integration account of crowding, provide some constraints of how the feature integration process could cause perceptual errors.


Figures

Figure 1
Figure 1
The templates for the letter g and their skeletons as rendered in Times-Roman (left) and Courier (right) font. Spatial complexity of a letter is defined as the length (number of pixels) of the morphological skeleton.
Figure 2
Figure 2
Proportion-incorrect for identifying the middle (target) letters of trigrams is plotted as a function of flanker complexity for Times-Roman (a) and Courier (b) fonts. In each panel, different colored symbols represent data from individual observers. Data averaged across the eight observers for each font are shown in panel c. For Times-Roman, the datum plotted at a flanker complexity of 0 represents the unflanked condition. Note the change in scale on the x-axis for panel c. Error bars represent the 95% confidence interval.
Figure 3
Figure 3
Proportion-incorrect for identifying the middle (target) letters of trigrams is plotted as a function of flanker complexity for the three categories of target complexity, for Times-Roman (top) and Courier (bottom) font. The slopes for the regression lines are 0.26, 0.14 and 0.11 %-error per unit of complexity score for Times-Roman and 0.13, 0.07 and 0.05 %-error per unit of complexity score for Courier. Error bars represent the 95% confidence interval.
Figure 4
Figure 4
Proportion-incorrect for identifying the middle (target) letters of trigrams is plotted as a function of the logarithm of the target-flanker similarity score for Times-Roman (a) and Courier (b) fonts. Details of the figure are as in Figure 2. Unfilled red squares (“Courier 2”) represent the data also collected from the study of Truong et al (2009) but from a different group of eight observers (see text for details). Error bars represent the 95% confidence interval.
Figure 5
Figure 5
Letter identification and mislocation error rate are plotted as a function of the logarithm of the target-flanker similarity for Times-Roman (a) and Courier (b) fonts.
Figure 6
Figure 6
Proportion-incorrect for identifying the middle (target) symbols of trigrams is plotted as a function of flanker complexity for all three experiments. Data points are color-coded and represent the different set of characters used (see legend for details). Data shown represent the averaged values across the group of observers tested for each font. Data points plotted at a flanker complexity of 0 represent the performance for the unflanked conditions.
Figure 7
Figure 7
Proportion-incorrect for identifying the middle (target) symbols of trigrams is plotted as a function of flanker complexity for the three categories of target complexity for Experiment 2 (a: Times-Roman) and Experiment 3 (b: Edwardian; c: Aristocrat).
Figure 8
Figure 8
Proportion-incorrect for identifying the middle (target) letters of trigrams is plotted as a function of flanker complexity and the logarithm of the target-flanker similarity for Times-Roman (left) and Courier (right) fonts. Data are binned in 64 different groups, according to their similarity (0.05 to 12.8%, in logarithmic intervals) and complexity scores (170 to 410, in intervals of 30 for the Times font and 220 to 380 in intervals of 20 for the Courier font). The shaded key on the right represents the different error rate.

References

    1. Andriessen JJ, Bouma H. Eccentric vision: adverse interactions between line segments. Vision Research. 1976;16:71–78. - PubMed
    1. Arnoult MD, Attneave F. The quantitative study of shape and pattern perception. Psychological bulletin. 1956;53:452–471. - PubMed
    1. Balas B, Nakano L, Rosenholtz R. A summary-statistic representation in peripheral vision explains visual crowding. Journal of Vision. 2009;9(12):1–18. - PMC - PubMed
    1. Bouma H. Interaction effects in parafoveal letter recognition. Nature. 1970;226:177–178. - PubMed
    1. Chastain G. Confusability and interference between members of parafoveal letter pairs. Perception & Psychophysics. 1982;32:576–580. - PubMed

Publication types