

Significance of gastroesophageal refluxate in relation to physical, chemical, and spatiotemporal characteristics in symptomatic intensive care unit neonates
- PMID: 21730816
- PMCID: PMC3210911
- DOI: 10.1203/PDR.0b013e31821f704d
Significance of gastroesophageal refluxate in relation to physical, chemical, and spatiotemporal characteristics in symptomatic intensive care unit neonates
Abstract
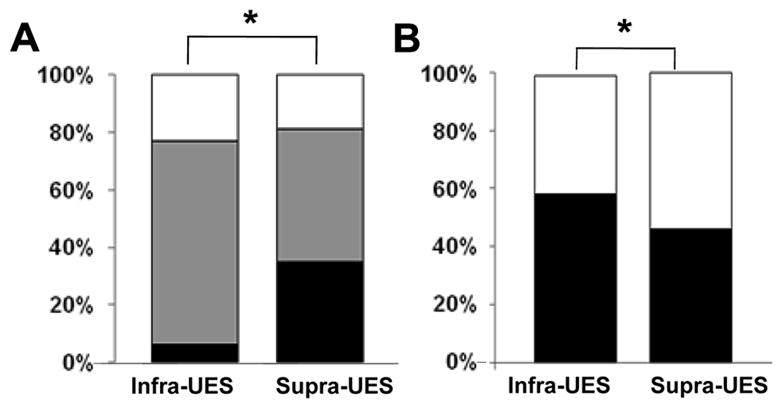
Gastroesophageal reflux disease (GERD) is a frequent consideration in intensive care unit neonates. We tested the hypothesis that symptoms in GERD are dependent on the spatiotemporal and physicochemical characteristics of reflux events by evaluating the symptom sensitivity index (SSI) and symptom index (SI) in relation to the refluxate characteristics. Thirty symptomatic neonates (30.7 ± 0.8 wk gestation) were evaluated using manometry and pH-impedance methods. During 704.3 h of recordings, 2063 gastroesophageal reflux (GER) were observed; 54% of the GER were associated with symptoms. Defined by physical characteristics, there were 51.3% liquid, 29.1% gas, and 19.6% mixed GER. Defined by chemical characteristics, there were 48.5% acid and 51.5% nonacid GER. Defined by most proximal extent, 79.2% were supra-UES (upper esophageal sphincter) and 20.8% were infra-UES. Higher SSI was noted with pH-only events (p < 0.0001 versus pH-impedance events). Higher SI was noted with movement symptoms (versus sensory, p = 0.04). In a subset analysis, the frequencies of GER events, acid clearance time, and SSI were all greater in chronic lung disease versus none (p < 0.001). In conclusion, clinical significance of symptoms as measured by SSI and SI and characterization of spatial-temporal-physical-chemical nature of GER events as defined by pH-impedance methods clarifies the definition of GERD.
Figures


Similar articles
-
Spatiotemporal characteristics of acid refluxate and relationship to symptoms in premature and term infants with chronic lung disease.Am J Gastroenterol. 2008 Mar;103(3):720-8. doi: 10.1111/j.1572-0241.2007.01748.x. Am J Gastroenterol. 2008. PMID: 18341491
-
Twenty-four-hour esophageal impedance-pH monitoring in healthy preterm neonates: rate and characteristics of acid, weakly acidic, and weakly alkaline gastroesophageal reflux.Pediatrics. 2006 Aug;118(2):e299-308. doi: 10.1542/peds.2005-3140. Epub 2006 Jul 10. Pediatrics. 2006. PMID: 16831894
-
Evaluation of Gastroesophageal Reflux in Symptomatic Young Infants Using Multichannel Intraluminal pH-Impedance Testing: A large Cohort Study from a Single Center.Am J Perinatol. 2025 Mar;42(4):486-494. doi: 10.1055/a-2405-1545. Epub 2024 Aug 29. Am J Perinatol. 2025. PMID: 39209301
-
Gastroesophageal Reflux Disease in the Neonatal Intensive Care Unit Infant: Who Needs to Be Treated and What Approach Is Beneficial?Pediatr Clin North Am. 2019 Apr;66(2):461-473. doi: 10.1016/j.pcl.2018.12.012. Epub 2019 Feb 1. Pediatr Clin North Am. 2019. PMID: 30819348 Free PMC article. Review.
-
Role of the multichannel intraluminal impedance technique in infants and children.J Pediatr Gastroenterol Nutr. 2009 Jan;48(1):2-12. doi: 10.1097/MPG.0b013e31818f0902. J Pediatr Gastroenterol Nutr. 2009. PMID: 19172117 Review.
Cited by
-
Impact of Feeding Strategies With Acid Suppression on Esophageal Reflexes in Human Neonates With Gastroesophageal Reflux Disease: A Single-Blinded Randomized Clinical Trial.Clin Transl Gastroenterol. 2020 Nov;11(11):e00249. doi: 10.14309/ctg.0000000000000249. Clin Transl Gastroenterol. 2020. PMID: 33259163 Free PMC article. Clinical Trial.
-
Differentiating esophageal sensitivity phenotypes using pH-impedance in intensive care unit infants referred for gastroesophageal reflux symptoms.Pediatr Res. 2021 Feb;89(3):636-644. doi: 10.1038/s41390-020-0930-6. Epub 2020 May 6. Pediatr Res. 2021. PMID: 32375162 Free PMC article.
-
Association between gastroesophageal reflux and bronchopulmonary dysplasia in preterm infants: a systematic review and meta-analysis.Front Nutr. 2025 Jun 24;12:1562939. doi: 10.3389/fnut.2025.1562939. eCollection 2025. Front Nutr. 2025. PMID: 40630162 Free PMC article.
-
The Role of Sleep in the Modulation of Gastroesophageal Reflux and Symptoms in NICU Neonates.Pediatr Neurol. 2015 Sep;53(3):226-32. doi: 10.1016/j.pediatrneurol.2015.05.012. Epub 2015 May 29. Pediatr Neurol. 2015. PMID: 26149107 Free PMC article.
-
The enigma of gastroesophageal reflux disease among convalescing infants in the NICU: It is time to rethink.Int J Pediatr Adolesc Med. 2020 Mar;7(1):26-30. doi: 10.1016/j.ijpam.2020.03.001. Epub 2020 Mar 5. Int J Pediatr Adolesc Med. 2020. PMID: 32373699 Free PMC article.
References
-
- Malcolm WF, Gantz M, Martin RJ, Goldstein RF, Goldberg RN, Cotten CM. Use of medications for gastroesophageal reflux at discharge among extremely low birth weight infants. Pediatrics. 2008;121:22–27. - PubMed
-
- Barney CK, Baer VL, Scoffield SH, Lambert DK, Cook M, Christensen RD. Lansoprazole, ranitidine, and metoclopramide: comparison of practice patterns at 4 level III NICUs within one healthcare system. Adv Neonatal Care. 2009;9:129–131. - PubMed
-
- Vandenplas Y, Rudolph CD, Di Lorenzo C, Hassall E, Liptak G, Mazur L, Sondheimer J, Staiano A, Thomson M, Veereman-Wauters G, Wenzl TG North American Society for Pediatric Gastroenterology Hepatology and Nutrition, European Society for Pediatric Gastroenterology Hepatology and Nutrition. Pediatric gastroesophageal reflux clinical practice guidelines: joint recommendations of the North American Society for Pediatric Gastroenterology, Hepatology, and Nutrition (NASPGHAN) and the European Society for Pediatric Gastroenterology, Hepatology, and Nutrition (ESPGHAN) J Pediatr Gastroenterol Nutr. 2009;49:498–547. - PubMed
-
- Jadcherla SR, Gupta A, Fernandez S, Nelin LD, Castile R, Gest AL, Welty S. Spatiotemporal characteristics of acid refluxate and relationship to symptoms in premature and term infants with chronic lung disease. Am J Gastroenterol. 2008;103:720–728. - PubMed
-
- Vela MF, Camacho-Lobato L, Srinivasan R, Tutuian R, Katz PO, Castell DO. Simultaneous intraesophageal impedance and pH measurement of acid and nonacid gastroesophageal reflux: effect of omeprazole. Gastroenterology. 2001;120:1599–1606. - PubMed
