Review
. 2011 Sep;31(9):1836-51.
doi: 10.1038/jcbfm.2011.93. Epub 2011 Jul 6.

Heterogeneity in the penumbra

Affiliations
Review

Heterogeneity in the penumbra

Gregory J del Zoppo et al. J Cereb Blood Flow Metab. 2011 Sep.

Abstract

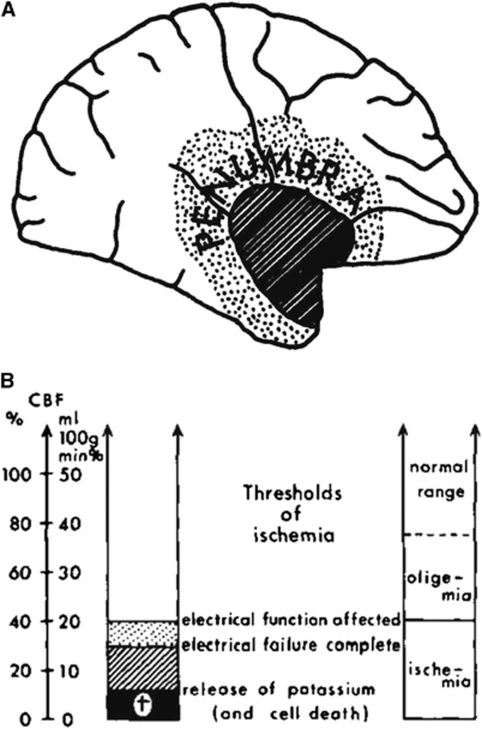
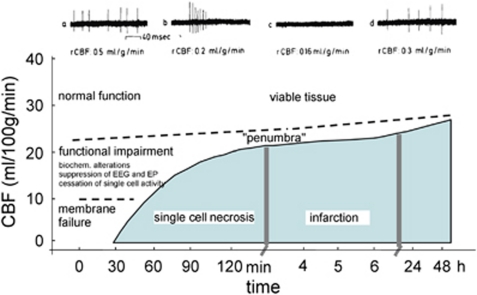
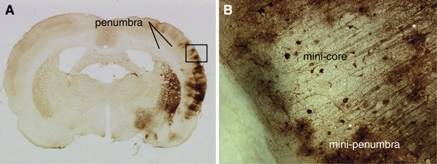
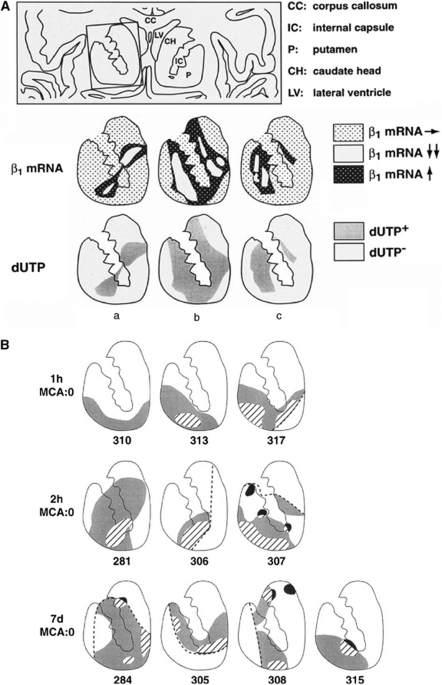
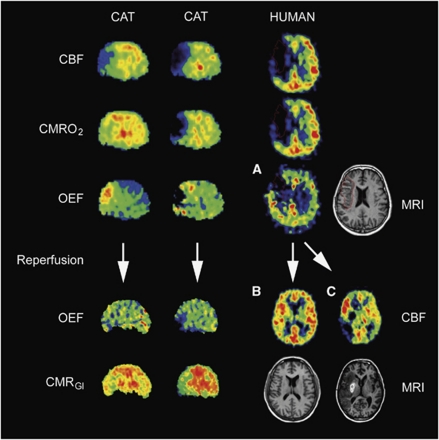
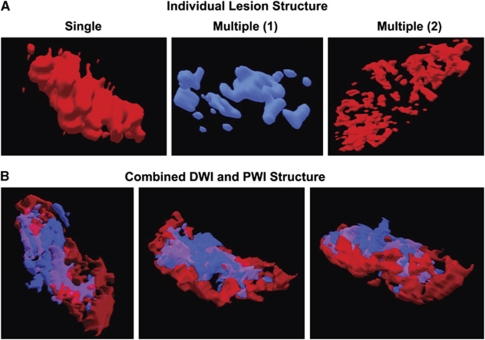
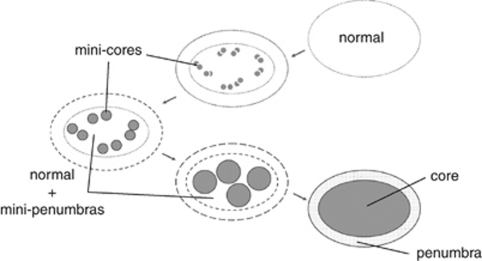
Original experimental studies in nonhuman primate models of focal ischemia showed flow-related changes in evoked potentials that suggested a circumferential zone of low regional cerebral blood flow with normal K(+) homeostasis, around a core of permanent injury in the striatum or the cortex. This became the basis for the definition of the ischemic penumbra. Imaging techniques of the time suggested a homogeneous core of injury, while positing a surrounding 'penumbral' region that could be salvaged. However, both molecular studies and observations of vascular integrity indicate a more complex and dynamic situation in the ischemic core that also changes with time. The microvascular, cellular, and molecular events in the acute setting are compatible with heterogeneity of the injury within the injury center, which at early time points can be described as multiple 'mini-cores' associated with multiple 'mini-penumbras'. These observations suggest the progression of injury from many small foci to a homogeneous defect over time after the onset of ischemia. Recent observations with updated imaging techniques and data processing support these dynamic changes within the core and the penumbra in humans following focal ischemia.


Figures

Figure 1
Figure 1
The ‘penumbra'. (A) Depiction of ‘the penumbra' based on rCBF and electrophysiological studies on the nonhuman primate (from Symon (1980), with permission). (B) Depiction of the relationship among rCBF, electrical failure in the dependent cerebral tissue, and ischemia (taken from a figure in the study by Astrup et al (1977), with permission). rCBF, regional cerebral blood flow.
Figure 2
Figure 2
Response of tissue to the duration of rCBF reduction, and development of the ‘penumbra'. Diagram of CBF thresholds required for the preservation of function and morphology of brain tissue. The activity of individual neurons is blocked when flow decreases below a certain threshold (dashed line) and returns when flow is increased again above this threshold. The upper recordings are from a single neuron before, during, and after reversible MCA occlusion. The fate of a single cell depends on the duration for which CBF is impaired below a certain level. The curved solid line demarcates conditions for structurally damaged from a functionally impaired, but morphologically intact tissue, the ‘penumbra'. The dashed line distinguishes tissue ‘not at risk' from the functionally impaired tissue. MCA, middle cerebral artery; rCBF, regional cerebral blood flow.
Figure 3
Figure 3
Development of ‘mini-penumbra' and ‘mini-core'. (A) Coronal section of the adult rat brain that shows Hsp70 protein (stain) 24 hours after occlusion of the right middle cerebral artery (MCA) for 10 minutes. Hsp70 immunoreactivity in the cortex, basal ganglia, and ventral thalamus and dorsal hypothalamus in the MCA distribution must be noted. Hsp70 staining delineates the entire penumbra, because this region of brain did not infarct, but would have infarcted if MCA occlusion had persisted for 2 hours. (B) The region of the cortex within the box in panel A shows a central area of little Hsp70 expression surrounded by a large number of Hsp70-stained cells that are predominantly microglia (two are denoted with green stars). For the purposes of this review, we have designated the central area that represents a possible microscopic infarct as the ‘mini-core' and the surrounding area of Hsp70-stained glia and some neurons as the ‘mini-penumbra'. This figure is adapted from the study by Zhan et al (2008). Hsp70, heat-shock protein 70.
Figure 4
Figure 4
Expression of microvessel-related gene products at 2 hours after MCA occlusion in the striatum. (A) Expression of the integrin β1 subunit mRNA by microvessels in the striatum of three nonhuman primate subjects (a–c) after MCA:O (Tagaya et al, 2001). Around mini-cores of absent β1 subunit mRNA, significant upregulation of the β1 subunit gene product was observed. The cores and boundary zones of β1 subunit upregulation corresponded to the regions where cells incorporated dUTP (i.e., dUTP+) (Tagaya et al, 1997). (B) Regions of VEGF expression (black), αν subunit (gray), and expression of both products (hatched) by activated microvessels in the striata of nonhuman primates that were subject to various periods of MCA occlusion (each image represents a separate animal) (Abumiya et al, 1999). The mini-cores of integrin or VEGF expression by microvessels must also be noted. MCA, middle cerebral artery; VEGF, vascular endothelial growth factor.
Figure 5
Figure 5
Sequential PET images of CBF, CMRO2, and OEF of permanent MCA occlusion in cats (left columns) compared with images of patients 12 hours after stroke (right columns). Two different cat subjects are shown (efficient and nonefficient perfusion) and three different patients are shown (A: early OEF defect with corresponding infarction on MRI, B: effective reperfusion without infarction, and C: ineffective/delayed reperfusion with large final partially hemorrhagic infarction). In the cat, the progressive decrease of CMRO2 and the reduction of OEF predict infarction. In the patient, the area with preserved OEF is not infarcted (outside region on late MRI, upper part of figure A). If reperfusion occurs before OEF is reduced, tissue can be salvaged (left: cat, and left: patient in the lower part of the figure B). If reperfusion is achieved after this therapeutic window, tissue cannot be salvaged (right: cat, and right: patient in lower part of the figure C). CBF, cerebral blood flow; CMRO2, cerebral metabolic rate for oxygen; MCA, middle cerebral artery; MRI, magnetic resonance imaging; OEF, oxygen extraction fraction; PET, positron emission tomography.
Figure 6
Figure 6
Heterogeneity of DWI and PWI lesion structure. (A) Examples of the three-dimensional structure of DWI and PWI lesions in acute stroke patients. Left, a single PWI lesion; center, a DWI lesion with multiple individual lesion components; right, a PWI lesion with multiple components. (B) Three-dimensional imaging of DWI and PWI lesions in acute stroke patients reveals intertwined regions of mismatch, DWI/PWI overlap, and early reperfusion. Regions that contain DWI lesions without superimposed PWI lesions (early reperfusion) are shown in blue; areas where DWI lesions have superimposed PWI lesions are shown in purple. The red areas are PWI lesions without superimposed DWI lesions (regions of mismatch). Reprinted from Stroke with permission from Olivot et al (2009). DWI, diffusion-weighted imaging; PWI, perfusion-weighted imaging.
Figure 7
Figure 7
A new hypothetical construct of the penumbra. The architecture and reversibility depend on time and location of rCBF reduction in the territory at risk after occlusion of a brain-supplying artery. The outside boundary represents the territory at risk of cerebral tissue that functions normally until rCBF is reduced for an extended period. Mini-cores coalesce with the duration of rCBF reduction devouring micro-penumbras. The period of evolution from normal function to the final state of the territory at risk may depend on a number of factors, including tissue location, depth of reduction of rCBF, inflammatory state at baseline and/or degree of inflammatory response, and other factors. The location of the mini-cores and mini-penumbras appear heterogeneously distributed. However, they in fact reflect the microvascular supply of tissue and cell vulnerabilities. rCBF, regional cerebral blood flow.

References

    1. Abumiya T, Lucero J, Heo JH, Tagaya M, Koziol JA, Copeland BR, del Zoppo GJ. Activated microvessels express vascular endothelial growth factor and integrin alpha(v)beta3 during focal cerebral ischemia. J Cereb Blood Flow Metab. 1999;19:1038–1050. - PubMed
    1. Ackerman RH, Correia JA, Alpert NM, Baron JC, Gouliamos A, Grotta JC, Brownell GL, Taveras JM. Positron imaging in ischemic stroke disease using compounds labeled with oxygen 15. Initial results of clinicophysiologic correlations. Arch Neurol. 1981;38:537–543. - PubMed
    1. Albers GW, Thijs VN, Wechsler L, Kemp S, Schlaug G, Skalabrin E, Bammer R, Kakuda W, Lansberg MG, Shuaib A, Coplin W, Hamilton S, Moseley M, Marks MP. Magnetic resonance imaging profiles predict clinical response to early reperfusion: the Diffusion and Perfusion Imaging Evaluation for Understanding Stroke Evolution (DEFUSE) study. Ann Neurol. 2006;60:508–517. - PubMed
    1. Astrup J, Siesjö BK, Symon L. Thresholds in cerebral ischemia—the ischemic penumbra. Stroke. 1981;12:723–725. - PubMed
    1. Astrup J, Symon L, Branston NM, Lassen NA. Cortical evoked potential and extracellular K+ and H+ at critical levels of brain ischemia. Stroke. 1977;8:51–57. - PubMed

Publication types

LinkOut - more resources