. 2011 Jul 1;34(7):931-41.
doi: 10.5665/SLEEP.1130.

Sleep, wake and phase dependent changes in neurobehavioral function under forced desynchrony

Affiliations

Sleep, wake and phase dependent changes in neurobehavioral function under forced desynchrony

Xuan Zhou et al. Sleep. .

Abstract

Study objectives: The homeostatic-circadian regulation of neurobehavioral functioning is not well understood in that the role of sleep dose in relation to prior wake and circadian phase remains largely unexplored. The aim of the present study was to examine the neurobehavioral impact of sleep dose at different combinations of prior wake and circadian phase.

Design: A between-participant design involving 2 forced desynchrony protocols varying in sleep dose. Both protocols comprised 7 repetitions of a 28-h sleep/wake cycle. The sleep dose in a standard protocol was 9.33 h per 28-h day and 4.67 h in a sleep-restricted protocol.

Setting: A time-isolation laboratory at the Centre for Sleep Research, the University of South Australia.

Participants: A total of 27 young healthy males participated in the study with 13 in the standard protocol (age 22.5 ± 2.2 y) and 14 in the sleep-restricted protocol (age 21.8 ± 3.8 y).

Interventions: Wake periods during both protocols were approximately 4 h delayed each 28-h day relative to the circadian system, allowing performance testing at different combinations of prior wake and circadian phase. The manipulation in sleep dose between the 2 protocols, therefore, allowed the impact of sleep dose on neurobehavioral performance to be examined at various combinations of prior wake and circadian phase.

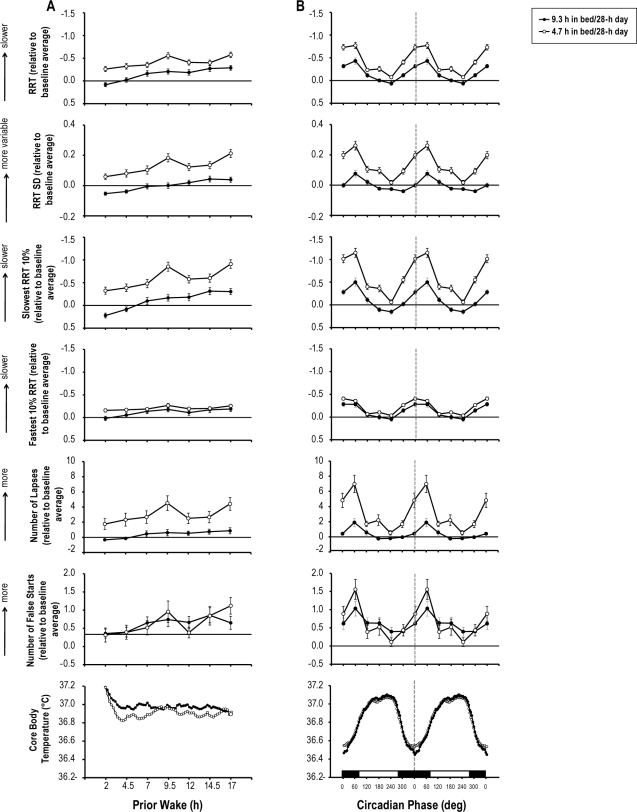
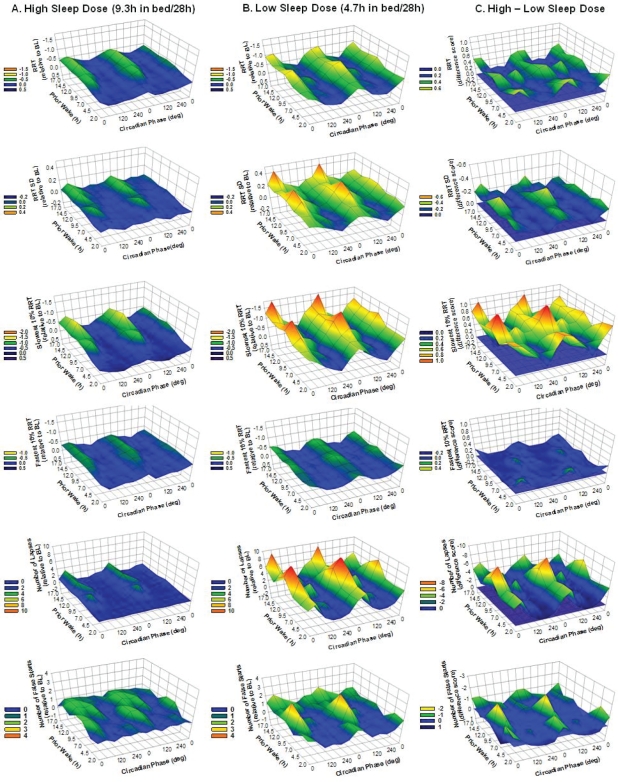
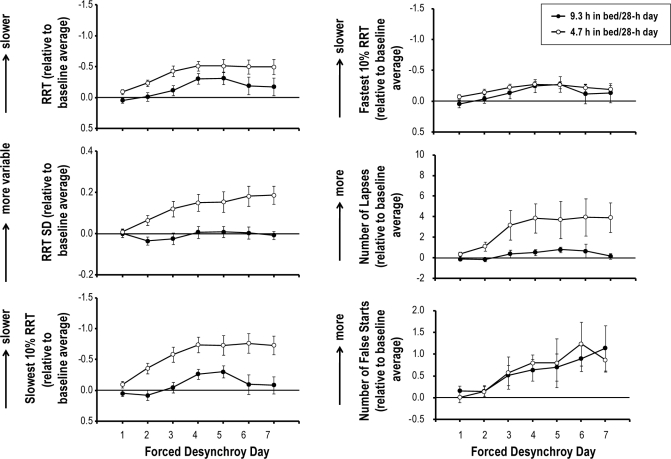
Measurements and results: Neurobehavioral function was assessed using the psychomotor vigilance task (PVT). There was a sleep dose × circadian phase interaction effect on PVT performance such that sleep restriction resulted in slower and more variable response times, predominantly during the biological night. This interaction was not altered by prior wakefulness, as indicated by a nonsignificant sleep dose × circadian phase × prior wake interaction.

Conclusions: The performance consequence of sleep restriction in our study was prominent during the biological night, even when the prior wake duration was short, and this performance consequence was in forms of waking state instability. This result is likely due to acute homeostatic sleep pressure remaining high despite the sleep episode.

Keywords: Neurobehavioral function; circadian phase; forced desynchrony; prior wake; sleep restriction; state instability.


Figures

Figure 1
Figure 1
Double raster plots of the standard (A) and sleep-restricted (B) 28-h day forced desynchrony protocols. White blocks represent scheduled wake periods, black blocks represent scheduled bed periods, and black dots represent scheduled PVT testing sessions. In both protocols, after 2 training days (TR) and a baseline day (BL), participants were scheduled to 7 repetitions of 28-h day (FD). The bed period of each 28-h day was 9.3 h in the standard protocol and 4.7 h in the sleep-restricted protocol. There was an additional recovery day (REC) in the sleep-restricted protocol.
Figure 2
Figure 2
Mean (± SEM) of total sleep time over forced desynchrony days for both sleep dose conditions. Note the error bars of the 4.7 h in bed/28-h day condition were obscured by the data points.
Figure 3
Figure 3
Means (± SEM) of reciprocal response time (RRT), standard deviation of RRT (RRT SD), slowest 10% RRT, fastest 10% RRT, the number of lapses and the number of false starts on the psychomotor vigilance task (PVT) and mean core body temperature as a function of scheduled prior wakefulness (A) and circadian phase of core body temperature (double plotted; (B)) and when the sleep dose is 9.3 h per 28-h day and when sleep dose is 4.7 h per 28-h day. Dotted lines indicate the core body temperature minimum. The black block represents circadian phases that correspond to the biological night, and the white block represents circadian phases that correspond to the biological day. Performance scores on each metric are expressed relative to the baseline average such that after this transformation ‘0’ on each y-axis corresponds to the baseline average (i.e., horizontal lines). The y-axes for RRT, slowest and fastest 10% RRT are reversed such that a higher point indicates worse performance.
Figure 4
Figure 4
Mean performance (z-axis) on selected metrics of the psychomotor vigilance task (PVT) at different combinations of scheduled prior wakefulness (y-axis) and circadian phase of core body temperature (x-axis, double plotted with 0 degree representing the core body temperature minimum). Each row shows data from the same metric, from top to bottom, reciprocal response time (RRT), standard deviation of RRT (RRT SD), slowest 10% RRT, fastest 10% RRT, the number of lapses and the number of false starts. Columns from left to right indicate the 9.3 h in bed per 28-h day condition (A), the 4.7 h in bed per 28-h day condition (B) and the difference between the 2 sleep dose conditions (C). Performance scores on each metric are expressed relative to the baseline average such that after this transformation ‘0’ on each z-axis corresponds to the baseline average. For column A and B, a higher value on the z-axis indicates worse performance relative to the baseline average (BL). For column C, a higher value on the z-axis indicates greater performance impairment such that the warmer the colour is the stronger the negative impact of sleep restriction is. To further facilitate data interpretation, each panel of column C includes a zero plain (in color blue) indicates no difference in performance between the 2 sleep dose conditions, i.e., no impact of sleep restriction.
Figure 5
Figure 5
Means (± SEM) of reciprocal response time (RRT), standard deviation of RRT (RRT SD), slowest 10% RRT, fastest 10% RRT, the number of lapses, the number of false starts on the psychomotor vigilance task (PVT) as a function of forced desynchrony day when the sleep dose is 9.3 h per 28-h day and when sleep dose is 4.7 h per 28-h day. Performance scores on each metric are expressed relative to the baseline average such that after this transformation ‘0’ on each y-axis corresponds to the baseline average (i.e., horizontal lines). The y-axes for RRT, slowest and fastest 10% RRT are reversed such that a higher point indicates worse performance.

Comment in

  • Draining the homeostat.
    Cohen DA. Cohen DA. Sleep. 2011 Jul 1;34(7):829-30. doi: 10.5665/SLEEP.1098. Sleep. 2011. PMID: 21731127 Free PMC article. No abstract available.

References

    1. Borbely AA. A two process model of sleep regulation. Hum Neurobiol. 1982;1:195–204. - PubMed
    1. Daan S, Beersma DG, Borbely AA. Timing of human sleep: recovery process gated by a circadian pacemaker. Am J Physiol. 1984;246:R161–83. - PubMed
    1. Doran SM, Van Dongen HP, Dinges DF. Sustained attention performance during sleep deprivation: evidence of state instability. Arch Ital Biol. 2001;139:253–67. - PubMed
    1. Dawson D, Reid K. Fatigue, alcohol and performance impairment. Nature. 1997;388:235. - PubMed
    1. Roach GD, Dawson D, Lamond N. Can a shorter psychomotor vigilance task be used as a reasonable substitute for the ten-minute psychomotor vigilance task? Chronobiol Int. 2006;23:1379–87. - PubMed

Publication types