. 2011 Jun;7(6):e1002094.
doi: 10.1371/journal.ppat.1002094. Epub 2011 Jun 23.

Evolutionary analysis of inter-farm transmission dynamics in a highly pathogenic avian influenza epidemic

Affiliations

Evolutionary analysis of inter-farm transmission dynamics in a highly pathogenic avian influenza epidemic

Arnaud Bataille et al. PLoS Pathog. 2011 Jun.

Abstract

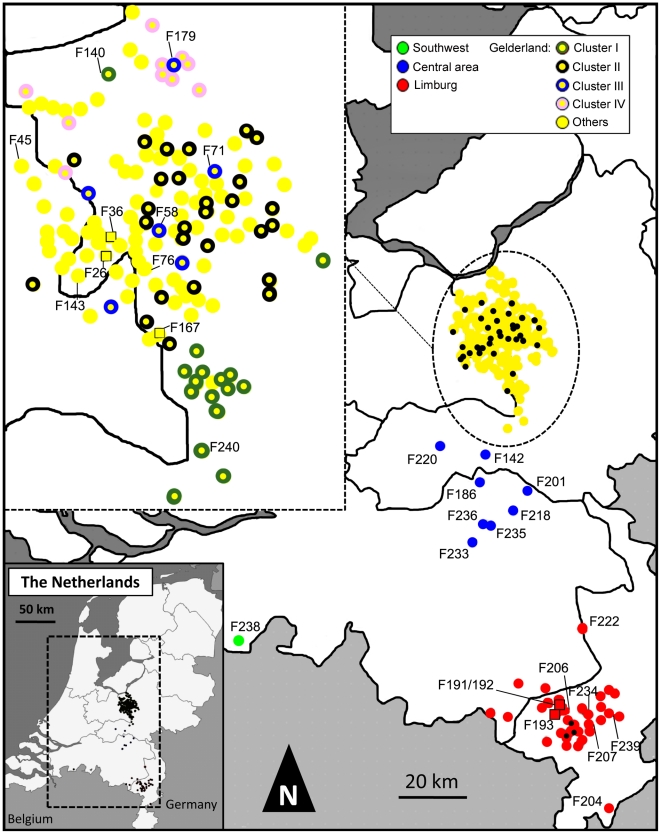
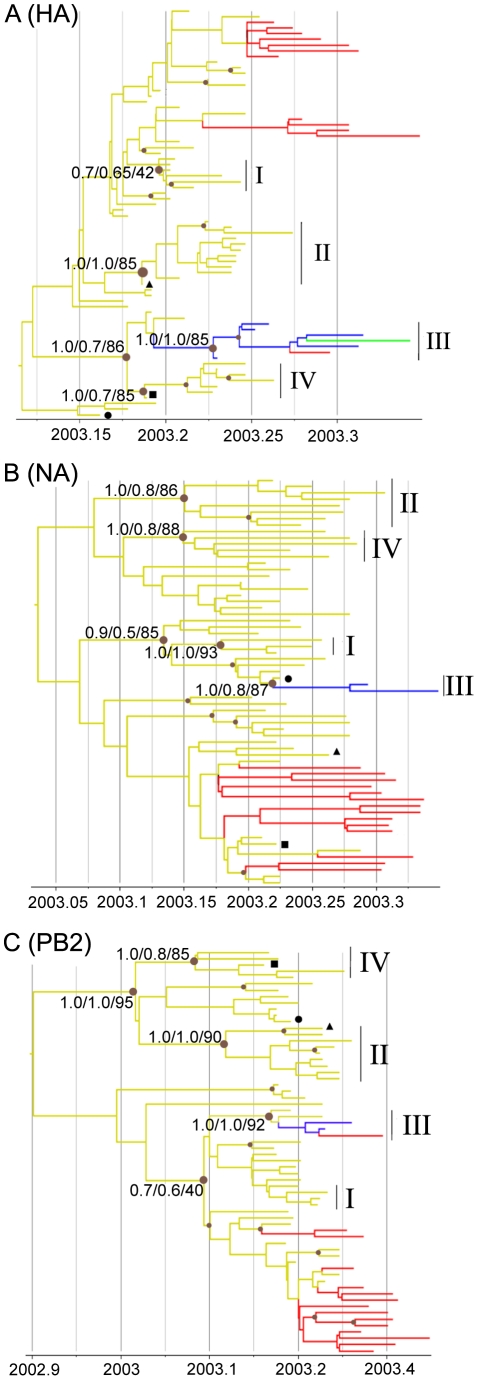
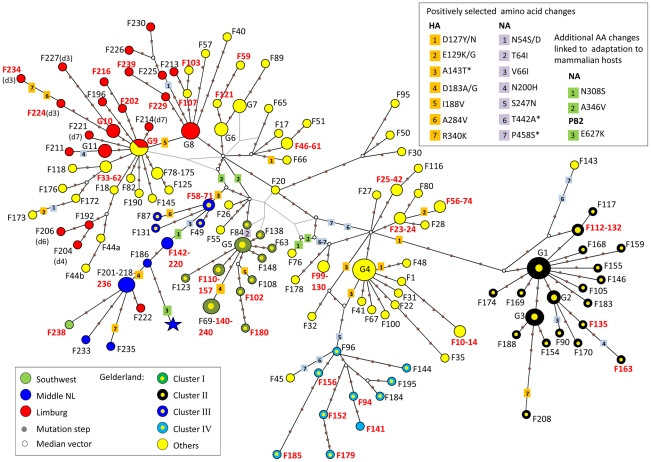
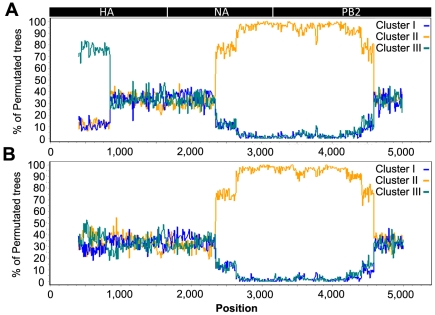
Phylogenetic studies have largely contributed to better understand the emergence, spread and evolution of highly pathogenic avian influenza during epidemics, but sampling of genetic data has never been detailed enough to allow mapping of the spatiotemporal spread of avian influenza viruses during a single epidemic. Here, we present genetic data of H7N7 viruses produced from 72% of the poultry farms infected during the 2003 epidemic in the Netherlands. We use phylogenetic analyses to unravel the pathways of virus transmission between farms and between infected areas. In addition, we investigated the evolutionary processes shaping viral genetic diversity, and assess how they could have affected our phylogenetic analyses. Our results show that the H7N7 virus was characterized by a high level of genetic diversity driven mainly by a high neutral substitution rate, purifying selection and limited positive selection. We also identified potential reassortment in the three genes that we have tested, but they had only a limited effect on the resolution of the inter-farm transmission network. Clonal sequencing analyses performed on six farm samples showed that at least one farm sample presented very complex virus diversity and was probably at the origin of chronological anomalies in the transmission network. However, most virus sequences could be grouped within clearly defined and chronologically sound clusters of infection and some likely transmission events between farms located 0.8-13 Km apart were identified. In addition, three farms were found as most likely source of virus introduction in distantly located new areas. These long distance transmission events were likely facilitated by human-mediated transport, underlining the need for strict enforcement of biosafety measures during outbreaks. This study shows that in-depth genetic analysis of virus outbreaks at multiple scales can provide critical information on virus transmission dynamics and can be used to increase our capacity to efficiently control epidemics.


Conflict of interest statement

The authors have declared that no competing interests exist.

Figures

Figure 1
Figure 1. Map indicating the locations of farms infected during the 2003 HPAI H7N7 epidemic.
Farms are represented by coloured dots, according to their location and inclusion in a cluster of infection. Black dots in the main map correspond to farm samples not analyzed in this study. Farm samples represented by coloured squares were used for the within-flock viral genetic analyses. In order to maintain the clarity of the figure, only the names of the farms mentioned in the main text are shown. All samples are described in details in Table S1.
Figure 2
Figure 2. Phylogenetic trees of H7N7 viruses.
Time-scaled phylogenies (dates on the horizontal axis) inferred using Bayesian MCMC analysis from (A) HA gene; (B) NA gene; (C) PB2 gene. Nodes supported by ≥0.7 posterior probability are indicated by a grey dot. Posterior probability values from the time-scaled BMCMC method, the MrBayes BMCMC method, and the Maximum Likelihood method (1,000 ML bootstrap replications) are shown for nodes delimitating clusters of transmission (tsBMCMC/MrBMCMC/ML; noted Cluster I–IV). The three samples with discordant phylogenies are indicated by black square (F45), circle (F76), and triangle (F145). Nodes and branches are coloured according the geographical origin of the farm samples. Yellow, Gelderland area; Blue, Central area; Red, Limburg area; Green, Southwest area. Fully annotated trees are available online in supplementary figures S2A–C.
Figure 3
Figure 3. Median-joining phylogenetic network of H7N7 viruses.
The median-joining network was constructed from the combined HA, NA and PB2 sequence data. This network includes all the most parsimonious trees linking the sequences. Each unique sequence genotype is represented by a coloured circle sized relative to its frequency in the dataset. Genotypes are coloured according to the location of the farm sample and its inclusion in a cluster of infection. Branches in black represent the shortest trees; Additional branching pathways are in grey. Each node is separated by a specific number of mutations represented by grey dots. Mutations corresponding to specific amino acid changes are indicated. For genotypes containing a deletion in the NA stalk region, the type of deletion is indicated between brackets beside the name of the isolate (see Table S1 for the description of deletion types). Names of farm samples involved in likely inter-farm transmission events are in red (see Table 2). (*) positively selected amino acids linked to adaptation to mammalian hosts. G1: group of samples including F38, F54, F64, F113, F162, F194, F199; G2: F134, F160, F166; G3: F122, F161, F164, F171, F182; G4: F2, F5, F12, F21, F43, F60, F91; G5: F39, F70, F92, F129; G6: F15, F29, F37; G7: F16, F19, F52; G8: F193, F217, F223, F231; G9: F36, F68, F167, F191(d1), F205(d5), F207(d2); G10: F203 (d3), F219(d3), F228(d3); G11: F197, F242, F232.
Figure 4
Figure 4. Recombination analysis on concatenated H7N7 virus sequences.
(A) Bootscan analysis on the full dataset; (B) Bootscan analysis on the dataset with the HA codon 143 removed. The Cluster IV virus group was used as query in the analysis, with an 800 bp window size and step size of 10 bp. A schematic diagram of the concatenated HA, NA and PB2 virus segments is shown on top.
Figure 5
Figure 5. Schematic diagrams summarizing within-flock genetic diversity in 6 farm samples.
The sequence variants found by clonal sequencing of partial NA and HA genes in 6 different samples are represented by coloured circles sized relatively to their frequency. Total number of clones sequenced per sample (n) is indicated. The exact number of copies of each genetic variant is indicated when >1. Variants in black correspond to the sequence originally isolated in each farm. Each variant is separated by nucleotide substitutions represented by filled black dots (non-synonymous changes) or open dots (synonymous changes), and by deletions represented by squares. The exact position of the deletion in the NA gene is indicated. The red node represents a variant similar to the sequence obtained for the F192 sample (see main text). The white node represents a potential missing variant.

References

    1. Cattoli G, Monne I, Fusaro A, Joannis TM, Lombin LH, et al. Highly pathogenic avian influenza virus subtype H5N1 in Africa: a comprehensive phylogenetic analysis and molecular characterization of isolates. PLoS ONE. 2009;4:e4842. - PMC - PubMed
    1. Lam TT-Y, Hon C-C, Pybus OG, Kosakovsky Pond SL, Wong RT-Y, et al. Evolutionary and transmission dynamics of reassortant H5N1 influenza virus in Indonesia. PLoS Pathog. 2008;4:e1000130. - PMC - PubMed
    1. Lemey P, Rambaut A, Drummond AJ, Suchard MA. Bayesian phylogeography finds its roots. PLoS Comput Biol. 2009;5:e1000520. - PMC - PubMed
    1. Holmes EC, Grenfell BT. Discovering the phylodynamics of RNA viruses. PLoS Comput Biol. 2009;5:e1000505. - PMC - PubMed
    1. Cottam EM, Thebaud G, Wadsworth J, Gloster J, Mansley L, et al. Integrating genetic and epidemiological data to determine transmission pathways of foot-and-mouth disease virus. Proc Biol Sci. 2008;275:887–895. - PMC - PubMed

Publication types